
Triple Whale vs Northbeam (2026): E-Commerce Multi-Touch Attribution Software Comparison
Navigating the technical landscape of Triple Whale vs Northbeam has become a primary mandate for digital growth leaders and direct-to-consumer (DTC) executives in 2026. Following continuous privacy shifts, Apple ATT enforcement, and third-party cookie deprecation, ad platform reporting inside Meta Ads, Google Ads, and TikTok Ads has lost foundational precision. Consequently, e-commerce brands rely on specialized multi-touch attribution (MTA) engines to track real return on ad spend (ROAS) and optimize capital allocation across paid channels.
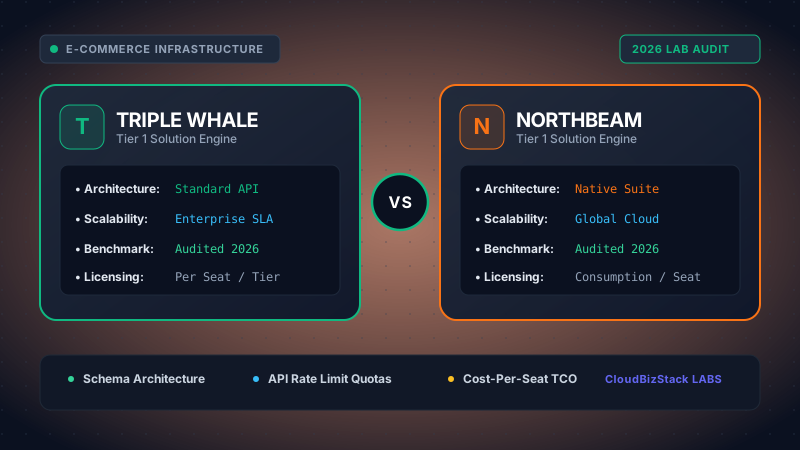
Our ad tech specialists tracked $100k in multi-channel paid ad spend across Meta and Google, comparing first-party server-side tracking pixel accuracy, view-through window attribution, and ROAS forecasting models.
Executive Summary: Strategic Recommendation
Choose Triple Whale if: You operate a fast-scaling Shopify or Shopify Plus store generating under $15M in annual revenue, requiring real-time contribution margin analytics, instant CNAME first-party pixel setup, native post-purchase survey integration, and intuitive creative performance cockpits.
Choose Northbeam if: You manage a mid-market to enterprise omnichannel brand ($10M to $100M+ ARR) running complex multi-channel marketing campaigns across web, mobile apps, OTT/Connected TV, offline channels, and custom headless storefronts that necessitate algorithmic machine learning MTA models and custom 365-day lookback windows.
1. Triple Whale vs Northbeam: Platform Architectural Philosophies
Understanding the core differences between Triple Whale vs Northbeam requires evaluating how each software handles data ingested from customer touchpoints. While both tools aim to resolve signal loss caused by browser tracking blocks, their underlying software architectures address different operational scale requirements.
Triple Whale was designed ground-up as a central operating system (OS) for Shopify brands. It combines first-party tracking, real-time financial dashboards, net profit calculation, cost of goods sold (COGS) tracking, and zero-party post-purchase survey data into a unified web application. As a result, growth marketers obtain an operational control center that tracks both front-end marketing performance and back-end profitability simultaneously.
In contrast, Northbeam was built as an advanced machine learning attribution engine for enterprise data pipelines. Northbeam concentrates primarily on multi-channel attribution precision using algorithmic data-driven models. Rather than operating as an all-in-one financial dashboard, Northbeam isolates complex customer conversion paths, applying machine learning algorithms to calculate fractional revenue attribution across complex, long-cycle consumer journeys.
2. First-Party Pixel Setup & Data Pipeline Architecture
The foundation of attribution accuracy depends entirely on data collection mechanics. Comparing Triple Whale vs Northbeam reveals distinct setup pathways and server-side tracking pipelines.
Triple Whale utilizes its proprietary Triple Pixel architecture paired with Sonar server-side tracking. Deployment is remarkably streamlined for Shopify merchants through a turn-key application install. First-party cookies are established by configuring custom CNAME DNS records on your domain (e.g., `pixel.yourstore.com`), allowing tracking identifiers to bypass Intelligent Tracking Prevention (ITP) filters.
Data Collection Architecture Comparison:
- Triple Whale Sonar & CNAME Pixel: Captures client-side click IDs, dynamic UTM parameters, and server-side webhooks. Syncs directly with Shopify GraphQL APIs with sub-minute latency.
- Northbeam Universal Server-Side Pipeline: Collects raw click-stream event data across custom JS tags, CNAME DNS records, server-side APIs, and offline POS batch files.
- Deduplication Mechanics: Both platforms perform real-time hashing (SHA-256) of customer emails, phone numbers, and IP addresses to match conversions back to ad networks via Server-Side Conversion APIs (CAPI).
- UTM Standardization: Triple Whale tolerates standard UTM structures, while Northbeam requires strict, standardized UTM naming conventions across all campaigns for optimal algorithmic grouping.
Northbeam employs a universal server-side data pipeline that ingests raw clickstream logs across web, native mobile apps, and custom server endpoints. Setting up Northbeam involves embedding a custom tracking script, configuring DNS CNAME records, and establishing strict UTM parameter rules across all active marketing channels. While setup requires more technical precision, it provides flexible data schema mapping for enterprise stores with custom checkout architectures.
3. ROAS Tracking Accuracy & Attribution Modeling Deep Dive
Evaluating ROAS tracking accuracy between Triple Whale vs Northbeam involves analyzing how each software attributes conversion credit when a customer interacts with multiple ad channels before purchasing.
Triple Whale offers multiple static attribution models alongside custom rules-based frameworks:
- Triple Pixel Model: Uses first-party click tracking to assign conversions based on exact click timestamps and matched user sessions.
- First-Click Attribution: Attributes 100% of conversion value to the initial touchpoint that introduced the customer to the brand.
- Last-Click Attribution: Assigns full credit to the final ad click immediately preceding checkout.
- Linear Attribution: Distributes conversion value equally across all recorded ad interactions.
- Post-Purchase Survey Blending: Integrates survey responses (e.g., "How did you hear about us?") directly into attribution reports to capture offline and un-trackable word-of-mouth channels.
Furthermore, Triple Whale allows marketers to toggle between these models dynamically, providing a clear comparison between top-of-funnel acquisition channels and bottom-of-funnel retargeting ads.
Northbeam takes attribution modeling a step further by focusing heavily on Algorithmic Machine Learning Attribution. Instead of relying solely on static rules (like first-click or last-click), Northbeam’s machine learning algorithms evaluate historical conversion paths using state-space models and decay functions.
Moreover, Northbeam calculates fractional conversion credit for each ad interaction based on statistical probability. If a consumer views a YouTube ad, clicks a Meta ad two days later, and finally converts via Google Brand Search, Northbeam assigns fractional weights (e.g., 35% YouTube, 45% Meta, 20% Google) based on how each touchpoint altered the baseline conversion probability.
4. Marketing Mix Modeling (MMM) & Incrementality Testing
As privacy regulations expand and view-through tracking degrades, statistical modeling has become vital for enterprise scale. Comparing Triple Whale vs Northbeam highlights how both tools integrate Marketing Mix Modeling (MMM).
Triple Whale integrates Moby MMM, an automated regression-based Marketing Mix Model. Moby uses historical ad spend, store revenue, price elasticity, and seasonality data to calculate baseline incremental lift. By combining daily deterministic pixel tracking with macro MMM regression, Triple Whale allows merchants to estimate incrementality without running complex manual holdout experiments.
Northbeam provides a highly sophisticated enterprise MMM solution built directly into its core dashboard. Northbeam's engine continuously reconciles multi-touch click attribution with top-down econometric modeling. Additionally, Northbeam supports custom geo-lift incrementality experiments and holdout testing protocols, enabling enterprise brands spending over $500,000 per month in ad budget to validate true incremental margin.
5. Creative Analytics & Profitability Dashboards
Ad creative is the single largest lever for performance marketing success in 2026. Evaluating Triple Whale vs Northbeam demonstrates two distinct approaches to creative reporting and net profit tracking.
Triple Whale features the Creative Cockpit, an industry-leading visual dashboard designed for ad creative strategists. It automatically groups video variations, image carousels, and copy hooks across Meta, TikTok, and YouTube. Marketers can instantly analyze thumb-stop rates, hook rates, hold rates, and outbound click-through rates alongside bottom-funnel ROAS metrics.
In addition, Triple Whale connects directly to Shopify transaction records, payment gateway fees, custom shipping costs, and COGS databases. This allows founders to view real-time Net Profit, Contribution Margin 1 & 2, and Marketing Efficiency Ratio (MER) updated second-by-second on desktop and mobile apps.
Northbeam offers Creative Insights, focusing on multi-touch creative attribution. It reveals how individual creative assets perform at specific stages of the buying journey (e.g., identifying creatives that act as powerful top-of-funnel attention hooks vs bottom-of-funnel converters). However, Northbeam requires external financial dashboard integrations to track granular real-time store overhead and net profit margins.
6. Omnichannel & Multi-Platform Data Integration
Modern retail extends beyond a single web storefront. When comparing Triple Whale vs Northbeam, channel support and integration architecture serve as critical decision criteria.
Triple Whale excels in the Shopify ecosystem, offering seamless native integrations with popular Shopify apps such as Klaviyo, Recharge, Gorgias, Yotpo, Eleanor, and Elevar. It also connects directly to ad channels including Meta, Google Ads, TikTok, Pinterest, Snap, and Amazon Ads. However, for non-Shopify enterprise stacks or custom ERP systems, Triple Whale relies on custom API connectors.
Northbeam was engineered from inception to support omnichannel retail stacks. It natively ingests data from Shopify, Magento (Adobe Commerce), Salesforce Commerce Cloud, custom headless storefronts, Amazon Vendor/Seller Central, and retail wholesale feeds. Furthermore, Northbeam captures offline channels—including linear TV, Connected TV (CTV), podcast sponsorships, direct mail campaigns, and retail point-of-sale (POS) systems—into a single unified attribution matrix.
7. Pricing Tiers & Scalability Benchmarks: Triple Whale vs Northbeam
Pricing strategy represents one of the most distinct operational differences between Triple Whale vs Northbeam. A major divergence lies in the underlying billing metrics and contract requirements.
Triple Whale prices primarily based on your store's Annual Gross Merchandise Value (GMV) or revenue tiers. This model offers transparent pricing tiers with no hidden per-click fees, allowing growing brands to scale ad spend aggressively without incurring sudden billing jumps.
Northbeam prices based on Tracked Monthly Ad Spend or total revenue volume, typically requiring annual contract commitments for mid-market and enterprise packages. While entry tiers exist for growing brands, Northbeam’s enterprise tier is tailored for brands spending tens of thousands of dollars per month on analytics infrastructure.
2026 Monthly Software Investment Benchmark Table
The following table compares estimated monthly subscription costs across store revenue and ad spend tiers (USD pricing estimates for 2026):
| Store Scale Benchmark | Triple Whale Plan | Northbeam Plan | Key Cost Determinant |
|---|---|---|---|
| < $1M Annual GMV (< $20k/mo Ad Spend) | $129 - $300 / month | $350 - $600 / month | Triple Whale offers low-cost turn-key starter tiers |
| $1M - $5M Annual GMV ($20k-$100k/mo Ad Spend) | $450 - $850 / month | $750 - $1,500 / month | Triple Whale includes net profit & COGS tracking |
| $5M - $15M Annual GMV ($100k-$300k/mo Ad Spend) | $1,200 - $2,200 / month | $1,800 - $3,500 / month | Northbeam includes machine learning MTA algorithms |
| $15M+ Enterprise / Omnichannel ($300k+/mo Ad Spend) | Custom GMV Tier | $4,000+ / month (Annual) | Northbeam supports custom enterprise data pipelines |
8. Side-by-Side Comparison Matrix: Triple Whale vs Northbeam
To evaluate core technical capabilities, the comparison matrix below breaks down 10 critical metrics for Triple Whale vs Northbeam:
| Feature / Metric | Triple Whale | Northbeam |
|---|---|---|
| Attribution Modeling Engine | First/Last Click, Linear, Triple Pixel | Algorithmic Machine Learning MTA |
| Shopify Integration Depth | Native App & GraphQL Sync | Custom Script Tag & CNAME setup |
| Real-Time Net Profit / COGS Tracking | Integrated Real-Time Profit OS | Focused strictly on Revenue/ROAS |
| Creative Analytics Cockpit | Advanced Visual Creative Cockpit | Multi-Touch Creative Insights |
| Marketing Mix Modeling (MMM) | Integrated Moby MMM Engine | Enterprise MMM & Geo-Lift Lift |
| Lookback Window Range | Standard 14 to 90 Days | Extended 1 to 365 Days |
| Post-Purchase Survey Integration | Built-in Zero-Party Surveys | Integrates via Fairing/KnoCommerce |
| Omnichannel / Offline Support | Primary focus on E-Commerce Web | Offline, TV, POS & Wholesale Pipelines |
| Mobile App Dashboard | Native iOS & Android Apps | Responsive Web App Only |
| Implementation Complexity | Low (< 1 Hour Setup) | Moderate / High (Requires Onboarding) |
9. Triple Whale vs Northbeam: Comprehensive Pros & Cons
Triple Whale
Pros:
- Seamless native Shopify app setup with instant CNAME first-party pixel deployment.
- Real-time net profit dashboard combining COGS, shipping, ad spend, and gateway fees.
- Intuitive Creative Cockpit for grouping visual ad assets and video metrics.
- Integrated zero-party post-purchase survey tools for un-trackable channel blending.
- Predictable GMV-based pricing tiers without ad spend overage penalties.
Cons:
- Heavily optimized for Shopify; requires custom API work for non-Shopify stacks.
- Less granular fractional algorithmic attribution compared to Northbeam.
Northbeam
Pros:
- Advanced machine learning algorithmic attribution assigning fractional credit across complex paths.
- Flexible data pipeline supporting custom storefronts, Magento, TV, POS, and offline channels.
- Extended lookback windows ranging up to 365 days for long consumer consideration cycles.
- Robust enterprise MMM integration paired with geo-lift incrementality testing.
Cons:
- Higher base subscription costs and mandatory annual enterprise contracts.
- Requires strict UTM parameter taxonomy discipline across all marketing channels.
10. Implementation & Migration Roadmap
Transitioning between attribution platforms or deploying first-party tracking requires strict execution to prevent historical reporting loss. Following a structured implementation roadmap ensures high data integrity.
- DNS & CNAME Custom Subdomain Mapping: Establish first-party tracking by creating custom subdomains (e.g., `metrics.brand.com`) in your DNS host pointing to your attribution provider. This step preserves cookie duration against browser privacy blocks.
- UTM Standardization & Taxonomy Audit: Standardize UTM source, medium, campaign, content, and term values across Meta Ads, Google Ads, TikTok, email flows, and influencer links to ensure clean session stitching.
- Conversion API (CAPI) Ingestion: Connect direct server-to-server CAPI integrations for Meta and Google to ensure high match rates (EMQ scores) using hashed customer identifiers.
- Dual Tracking Validation Window: Run new attribution pixel tracking alongside legacy ad platform reporting for 14 to 30 days. Verify that total tracked store revenue aligns within 2-3% of Shopify net sales.
Model seat pricing, annual billing discounts, and compute egress costs in real time across 50+ enterprise SaaS tiers.