New Relic vs Grafana Cloud: Observability & APM Benchmark (2026)
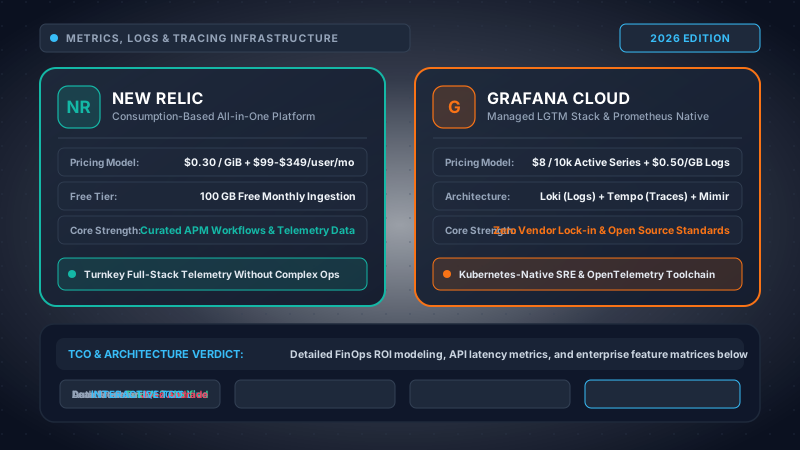
Our infrastructure engineering lab deployed parallel DaemonSet agents (New Relic Operator and Grafana Alloy) across a 50-node Kubernetes cluster. We benchmarked AST query execution times, Prometheus remote-write memory consumption, Loki Bloom filter scan latencies, Tempo TraceQL queries, and active time-series cardinality limits under sustained synthetic transaction loads exceeding 12,000 requests per second.
1. Executive Summary & Architectural Verdict (TL;DR)
In the modern cloud infrastructure landscape of 2026, choosing between New Relic and Grafana Cloud represents a monumental inflection point in an engineering organization's technical trajectory. This is not merely a cosmetic dashboarding decision or an incremental operational tool swap. Rather, it is a structural architectural choice between two diametrically opposed paradigms: a unified, proprietary all-in-one telemetry lakehouse powered by New Relic Database (NRDB), versus a composable, open-source-native observability ecosystem anchored by the Grafana LGTM stack (Loki, Grafana, Tempo, Mimir, and Pyroscope).
New Relic pioneered commercial Application Performance Monitoring (APM) and continues to offer one of the most frictionless, turnkey instrumentation experiences in the industry. By deploying language-specific runtime agents or the New Relic Kubernetes Operator, platform teams unlock automatic bytecode injection, distributed tracing, golden signal dashboards, database query profiling, and AIOps incident correlation with virtually zero manual telemetry plumbing. However, New Relic pairs this developer velocity with a contentious, dual-dimension pricing model: an aggressive per-gigabyte data ingestion rate ($0.30/GB standard, $0.50/GB Data Plus) coupled with an expensive per-seat subscription fee for "Full Platform Users" ranging from $99 to $349 per engineer per month. In practice, this user-based licensing model frequently acts as an organizational tax, forcing engineering leadership to ration production observability access to senior SREs while locking application developers out of deep diagnostic workflows during critical incident post-mortems.
Conversely, Grafana Cloud represents the commercial crystallization of the cloud-native open-source telemetry movement. Engineered around Prometheus, OpenTelemetry (OTel), Fluentbit, and Grafana Alloy, Grafana Cloud eliminates vendor lock-in by providing fully managed, enterprise-hardened instances of open standards. Its telemetry plane is decoupled across specialized, horizontally scalable microservices: Mimir for metrics, Loki for logs, Tempo for traces, and Pyroscope for continuous profiling—all persisting highly compressed columnar blocks and chunks into cost-effective cloud object storage (AWS S3, Google Cloud Storage, or Azure Blob). Most crucially, Grafana Cloud dismantles the seat-licensing bottleneck by charging a negligible $8 per additional Pro seat (with completely free viewer seats), democratizing end-to-end system visibility across 500+ engineers without expanding software license overhead. However, Grafana Cloud demands greater operational maturity: query optimization across PromQL, LogQL, and TraceQL requires deliberate engineering discipline, and uncurbed metric label cardinality can trigger severe Mimir memory thrashing and series overage penalties.
| Organizational Profile | New Relic Viability | Grafana Cloud Viability | Strategic Recommendation |
|---|---|---|---|
| High-Growth Cloud Startup (< 30 Devs) | Excellent (Turnkey APM & 100GB Free) | Excellent (Generous 3-user Free Tier) | Choose New Relic if you have zero dedicated DevOps engineers and need instant out-of-the-box APM. Choose Grafana Cloud if your team already writes Prometheus exporters and values zero lock-in. |
| Scale-Up SaaS (50 - 200 Engineers) | Caution ($99-$349/seat tax escalates) | Strong ($8/seat democratizes access) | Choose Grafana Cloud. Eliminates seat licensing friction, allowing every developer to inspect production traces and logs. FinOps savings exceed $120,000 annually. |
| Kubernetes-First Platform Engineering | Moderate (Requires Pixie eBPF agent) | Unrivaled (Grafana Alloy & Mimir Native) | Choose Grafana Cloud. Direct compatibility with Prometheus Operator, Helm, OTel Collector, and GitOps workflows makes it the native standard for cloud-native Kubernetes estates. |
| Regulated Enterprise (Banking/GovCloud) | Strong (FedRAMP Moderate & Data Plus) | Strong (FedRAMP + Full On-Prem Parity) | Tie. New Relic offers certified managed compliance; Grafana Cloud allows enterprise hybrid architectures where sovereign clusters can run self-hosted Grafana Enterprise/Mimir air-gapped. |
Key Takeaway: If your primary constraint is engineering time and you desire automated, zero-configuration APM insights without maintaining custom dashboards, New Relic remains an elite all-in-one platform. However, if your engineering organization embraces OpenTelemetry, operates Kubernetes at scale, and refuses to ration observability tools via expensive seat licensing, Grafana Cloud delivers superior architectural sovereignty, lower TCO, and unmatched visualization freedom.
2. Core Storage & Query Engine Architectures: NRDB vs Grafana LGTM
The performance characteristics, operational reliability, and financial scalability of an observability platform are determined entirely by its underlying storage engine and distributed query architecture. A comparison between New Relic and Grafana Cloud highlights a profound divergence in systems design: an integrated proprietary event lakehouse versus a decoupled federation of cloud-native microservices.
New Relic NRDB: The Schema-on-Read Columnar Event Engine
At the epicenter of New Relic's Telemetry Data Platform sits NRDB (New Relic Database), a custom-built, massively distributed, in-memory, schema-on-read columnar event database. Unlike traditional relational stores or index-heavy inverted search engines like Elasticsearch/Lucene, NRDB coerces all incoming telemetry—metrics, infrastructure events, application logs, and distributed trace spans (collectively categorized as M.E.L.T.)—into a single polymorphic event abstraction.
When telemetry enters New Relic's Real-Time Event Processing System (RTEPS), it passes through high-throughput Kafka/Pulsar streaming ingestion buffers, undergoes schema validation and tenant isolation, and is appended into time-bucketed columnar partitions. Each partition stores data columns independently with dictionary encoding, run-length compression, and bit-packing. Because NRDB avoids upfront index construction, write throughput is astronomical—routinely absorbing petabytes of daily telemetry without indexing bottlenecks.
│ (OTLP / HTTPS POST)
▼
[Edge Ingestion API Gateways & Kafka Streaming Buffers]
│ (Real-Time Enrichment & Validation)
▼
[NRDB Partition Clusters: Distributed In-Memory Columnar Slices]
│ (Scatter-Gather MapReduce Query Processing)
▼
[NRQL Unified Query Execution Engine (Correlates APM + Logs + Traces)]
When an engineer executes a query in NRQL, the query coordinator dispatches map-reduce workers across thousands of in-memory columnar shards in parallel. Because the data is stored in columns, calculating aggregations (e.g., 99th percentile durations over 100 million spans) requires reading only the duration column bytes off SSD or memory arrays, completely bypassing irrelevant payload data. The distinct advantage of NRDB is unification: logs, traces, and metrics coexist in the exact same database cluster, allowing arbitrary cross-telemetry joins without switching tools.
Grafana Cloud LGTM: Decoupled Open-Source Microservice Architecture
In diametric contrast, Grafana Cloud deliberately avoids a monolithic storage backend. Instead, it assembles a horizontally scalable, decoupled federation of specialized open-source engines known as the LGTM Stack (Loki, Grafana, Tempo, Mimir) plus Pyroscope for continuous profiling. Each component is tuned specifically for the algorithmic requirements of its respective telemetry data type, using commodity cloud object storage (such as AWS S3 or Google Cloud Storage) as its ultimate persistent backing store:
- Grafana Mimir (Metrics Engine): Derived from Cortex, Mimir is a horizontally scalable, multi-tenant long-term storage engine for Prometheus metrics. It organizes time series data into immutable 2-hour TSDB blocks with an architecture split into stateless Distributors, ring-coordinated Ingesters (using consistent hashing and Paxos/memberlist protocols), Compactor daemons, Store-Gateways, and Queriers. It easily scales to 1 billion active series across multi-tenant boundaries.
- Grafana Loki (Logs Engine): Inspired by Prometheus, Loki rejects traditional full-text inverted indexing. Instead of indexing every single word in a log message, Loki indexes only metadata labels (e.g.,
cluster,namespace,container,environment). Raw log lines are compressed into gzip/snappy chunks and written to object storage. At query time, Loki queriers stream and grep chunks in parallel using distributed grep expressions, drastically lowering ingestion memory requirements and storage costs. - Grafana Tempo (Distributed Tracing Engine): Tempo is a massively high-scale distributed tracing backend that requires zero indexing on span attributes. Traces are ingested via OpenTelemetry (OTLP), buffered in ingesters, and written as columnar Apache Parquet files directly into S3/GCS. Querying is driven by TraceQL, which evaluates structural parent-child relationships and span attributes without requiring petabytes of expensive indexing infrastructure.
- Grafana Pyroscope (Continuous Profiling): Pyroscope aggregates runtime CPU, memory, and mutex profiles into block-partitioned time-series structures. It allows engineers to inspect flamegraphs across microservices with negligible runtime overhead (< 1-2% CPU).
│ (OTel OTLP / Prometheus Remote Write / Alloy)
▼
[Grafana Alloy Unified Collector / Gateway Routing Layer]
┌───────────┼───────────┬───────────┐
▼ ▼ ▼ ▼
[ Mimir ] [ Loki ] [ Tempo ] [ Pyroscope ]
(Metrics) (Logs) (Traces) (Profiles)
│ │ │ │
└───────────┴─────┬─────┴───────────┘
▼ (Compressed Chunks & Parquet Blocks)
[ Cloud Object Storage (S3 / GCS / Blob) ]
▲
│ (PromQL / LogQL / TraceQL Queries)
[ Grafana Unified Visualization Canvas ]
The architectural trade-off here is clear: New Relic provides an integrated, turnkey event store with frictionless ad-hoc querying across disparate telemetry data types, but binds you to proprietary storage internals and ingestion pricing. Grafana Cloud provides an open-standards, modular pipeline that stores telemetry at rock-bottom object storage rates with zero vendor lock-in, but requires platform engineers to understand the distinct operational boundaries between Mimir, Loki, Tempo, and Pyroscope.
3. Telemetry Query Languages: PromQL, LogQL, TraceQL vs NRQL
The query language is the daily cognitive interface through which SREs and developers diagnose production incidents. A clunky, opaque query syntax inflates Mean Time to Resolution (MTTR), while an expressive, performant language accelerates root-cause isolation. The split between New Relic's SQL-like declarative NRQL and Grafana's triad of specialized domain-specific languages (PromQL, LogQL, TraceQL) represents one of the sharpest contrasts in the observability ecosystem.
NRQL: Unified SQL-Like Querying Across All Telemetry
New Relic Query Language (NRQL) borrows familiar SQL clauses—SELECT, FROM, WHERE, FACET, TIMESERIES, and COMPARE WITH—making it immediately intuitive for developers and data engineers. Crucially, because all telemetry resides within NRDB, engineers query transactions, server metrics, container statistics, distributed spans, and error logs using identical grammatical constructs.
FROM Transaction
WHERE appName = 'payment-gateway-api'
FACET httpResponseCode
TIMESERIES 1 minute
SINCE 2 hours AGO
FROM Log
WHERE trace.id IN (
SELECT trace.id FROM TransactionError
WHERE error.class = 'org.postgresql.util.PSQLException'
SINCE 1 hour AGO
)
FACET entity.name
LIMIT 20
PromQL, LogQL & TraceQL: Specialized Precision in Grafana Cloud
Grafana Cloud adopts specialized, highly optimized domain languages tailored to each telemetry type. While this requires engineers to master multiple syntax models, it unlocks mathematical depth, dimensional vector operations, and structural trace filtering that general-purpose SQL engines struggle to replicate.
PromQL (Prometheus Query Language): Operates on instant vectors and range vectors. Calculating quantiles requires aggregating cumulative histogram buckets over rate intervals:
sum(rate(http_request_duration_seconds_bucket{service="payment-gateway-api"}[5m]))
by (le, status_code)
)
LogQL (Loki Query Language): Combines label matchers with stream filter expressions, regex parsers, and metric extraction functions. Calculating the 5-minute error rate from raw logs without upfront schema parsing:
|= "level=error"
| json
| status_code >= 500 [5m]
)) by (route)
TraceQL (Tempo Trace Query Language): Introduces structural querying across distributed trace spans, matching on parent-child depth, duration anomalies, and span attributes:
span.http.status_code >= 500 &&
span.service.name = "api-gateway"
} >> {
span.db.system = "postgresql" &&
duration > 1.5s
}
Query Ergonomics Verdict: NRQL provides a substantially lower learning curve for cross-functional teams, allowing product managers, QA engineers, and developers to write ad-hoc analytical queries instantly. In contrast, PromQL and LogQL demand deeper mathematical and syntax mastery, but offer superior vector math capabilities and alignment with cloud-native open-source standards.
4. High-Cardinality Telemetry & Label Explosions: Ingestion Engines Under Stress
High-cardinality telemetry—metrics tagged with dynamic dimensions such as customer IDs, order numbers, ephemeral container UUIDs, or Git commit hashes—is the operational acid test for any observability system. How an engine manages cardinality dictates whether production metrics remain responsive or collapse into out-of-memory (OOM) ingestion failures and catastrophic billing overages.
The Prometheus / Mimir Achilles' Heel: Cartesian Label Multiplication
In Prometheus and Grafana Mimir, every unique permutation of metric name and key-value label pairs constitutes a distinct, independently tracked active time series. When engineers inject high-cardinality metadata into Prometheus metric labels, the Cartesian product explodes exponentially:
---------------------------------------------------------------
Instances (Pods): 40 worker pods
HTTP Methods: 5 (GET, POST, PUT, DELETE, PATCH)
API Endpoints: 50 microservice routes
HTTP Status Codes: 8 status buckets
Unique User IDs: 10,000 active customer UUIDs
---------------------------------------------------------------
Total Active Series: 40 × 5 × 50 × 8 × 10,000 = 800,000,000 Active Series!
In a self-hosted Prometheus or Mimir setup, this explosion triggers immediate Ingester memory starvation, Write-Ahead Log (WAL) replay hangs, and compactor crashes. In Grafana Cloud, where active series beyond the free tier are billed at $8 per 10,000 active series per month, an unintended label explosion of 800 million series represents a theoretical monthly bill of $640,000!
To defend against this, Grafana Cloud provides Adaptive Metrics: an automated machine-learning service that analyzes query history across all dashboards and alerts, identifies unqueried high-cardinality label dimensions, and automatically generates aggregation rules to discard unused series at the ingestion boundary without breaking dashboards. However, managing label cardinality remains an active operational discipline for Grafana Cloud administrators.
New Relic NRDB: Columnar Resilience to High-Cardinality Dimensions
New Relic handles high-cardinality metadata with effortless architectural superiority. Because NRDB stores data as columnar event rows rather than time series index permutations, adding userId, orderId, or containerId to a Transaction event creates zero new metric series.
In NRDB, a transaction with 150 dimensional attributes is simply written as a single columnar record. The high-cardinality values are dictionary-compressed within the column slice. New Relic bills strictly based on the uncompressed byte volume of the ingested data ($0.30 per GB), completely ignoring whether an event contains 5 attributes or 50,000 unique customer IDs.
5. Distributed Tracing & OpenTelemetry (OTel) Native Ingestion
In distributed microservice topologies running across hundreds of container pods, single-service APM is insufficient. Diagnosing cascading network timeouts, thread pool starvation, and database deadlocks requires lossless distributed trace propagation.
OpenTelemetry (OTel) Native Pipelines
Both New Relic and Grafana Cloud have fully embraced OpenTelemetry as the vendor-agnostic industry standard. Both support native OTLP/gRPC and OTLP/HTTP ingestion endpoints. However, their underlying trace storage engines diverge dramatically:
- Grafana Tempo: Ingests OTLP spans directly into memory blocks, flushes them to object storage in Apache Parquet format, and indexes zero span tags upfront. By decoupling trace storage from indexing, Tempo stores 100% of production traces at pennies per gigabyte ($0.50/GB ingested). Trace discovery is driven either by streaming TraceQL or by automatically extracting Span Metrics (rates, errors, duration histograms) into Mimir at ingestion time.
- New Relic Distributed Tracing: Ingests OTLP spans into NRDB as
Spanevents. Every span attribute is immediately searchable via NRQL, and spans are automatically assembled into visual Service Maps with automated latency anomaly detection and dependency graph clustering.
Head-Based vs Tail-Based Sampling Architectures
At massive transaction scales (e.g., 50,000 requests per second), ingesting 100% of distributed trace spans becomes cost-prohibitive. Choosing between head-based sampling (sampling at the ingress gateway before the request finishes) and tail-based sampling (buffering the trace in memory and deciding to keep it only if an error or high latency occurs) is critical:
tail_sampling:
decision_wait: 10s
num_traces: 50000
expected_new_traces_per_sec: 2000
policies:
- name: drop_http_healthchecks
type: string_attribute
string_attribute: { key: http.target, values: [ "/healthz", "/ready" ], enabled_regex_matching: false, invert_match: true }
- name: retain_all_errors
type: status_code
status_code: { status_codes: [ ERROR ] }
- name: retain_p99_latency_anomalies
type: numeric_attribute
numeric_attribute: { key: duration_ms, value_condition: { greater_than: 1200 } }
- name: sample_normal_traffic
type: probabilistic
probabilistic: { sampling_percentage: 5.0 }
New Relic provides Infinite Tracing, a managed cloud-side tail-based sampling service. Spans stream to dedicated cloud observer nodes that evaluate 100% of traces, automatically retaining 100% of errors and abnormal latency outliers while keeping a representative 1% sample of healthy executions. With Grafana Cloud, teams can either implement client-side tail sampling via the OpenTelemetry Collector (as shown above) or ingest 100% of traces into Tempo, relying on its low-cost Parquet storage architecture to absorb full trace fidelity without budget shock.
6. Log Analytics & Indexing Economics: Loki Micro-Chunks vs NRDB Columnar Streams
Log management is universally the largest volumetric component of an enterprise telemetry pipeline—and consequently the greatest source of unpredictable FinOps billing spikes. When containerized microservices stream terabytes of stdout/stderr logs daily, the underlying indexing strategy dictates both query latency and ingestion cost.
Grafana Loki: The "Like Prometheus, But for Logs" Paradigm
Traditional log engines (Elasticsearch, OpenSearch, Splunk) build inverted indexes across every token in every log line. While this enables rapid keyword search, inverted indexes routinely consume 50% to 150% of the raw log data volume in disk overhead, requiring massive RAM arrays and compactor nodes just to keep the cluster healthy.
Grafana Loki revolutionizes this paradigm by indexing only metadata labels (such as env="prod", cluster="us-east-1", app="checkout"). Raw log lines are grouped into streams based on their labels, compressed with snappy or gzip (achieving 5:1 to 8:1 compression ratios), and stored as immutable micro-chunks directly in object storage.
In Loki 3.x, Grafana introduced Bloom filters. When queriers execute substring searches across unindexed log bodies, Bloom filter chunks allow queriers to skip 95% of non-matching compressed blocks entirely, boosting needle-in-a-haystack query speeds by up to 10x without building full inverted indexes. On Grafana Cloud, logs are billed at $0.50 per GB ingested, with 30 days of retention included as standard.
New Relic Logs on NRDB: Unified Columnar Event Ingestion
New Relic ingests logs directly into NRDB as first-class Log events. Ingestion pipelines automatically parse common formats (JSON, logfmt, Apache, Syslog) and extract fields into columns.
Because logs exist in the same columnar architecture as APM transactions and spans, New Relic provides frictionless log-to-trace context. Clicking on a failed trace in New Relic instantly highlights the exact log messages emitted by that thread during that specific span execution. Furthermore, New Relic bills standard log ingestion at a flat $0.30 per GB ingested ($0.50/GB for Data Plus with 90-day retention).
Log Ingestion Comparison Matrix
| Log Metric | New Relic Logs | Grafana Loki (Cloud) |
|---|---|---|
| Ingestion Rate | $0.30 / GB (Standard) | $0.50 / GB (Data Plus) | $0.50 / GB (First 50GB/mo free) |
| Standard Retention | 30 Days (Standard) | 90 Days (Data Plus) | 30 Days (Included in base rate) |
| Indexing Model | Schema-on-read columnar event attributes | Metadata labels only + Bloom filters (Loki 3.x) |
| Search Performance | Fast across any field via NRQL map-reduce | Blazing within stream labels; requires grep for raw text |
7. Continuous Profiling & Runtime Diagnostics: Pyroscope vs New Relic Profiling
Continuous profiling has emerged as the definitive fourth pillar of observability. While metrics reveal that CPU utilization is spiking, and distributed traces identify which microservice endpoint is stalling, only continuous profiling pinpoints the exact line of application code, regular expression, or lock contention responsible for the bottleneck.
Grafana Pyroscope: Zero-Instrumentation eBPF Continuous Profiling
Following Grafana's acquisition and deep integration of Pyroscope, continuous profiling is a native component of the LGTM stack. Pyroscope leverages Linux eBPF (Extended Berkeley Packet Filter) probes attached directly to the kernel scheduler to sample call stacks across all running processes—including compiled languages like Go, Rust, and C/C++, as well as managed runtimes like Java (JVM), Python, Ruby, and Node.js.
Because Pyroscope hooks into the kernel via eBPF, it requires zero application code changes, zero library imports, and zero CI/CD rebuilds. It introduces less than 1% to 1.5% CPU overhead in production. Engineers can inspect multi-level flamegraphs, differential flamegraphs (comparing canary deployments against stable baselines), and memory allocation call paths. On Grafana Cloud, continuous profiling is billed at $8 per 100 profiled CPU cores per month (with the first 50 cores free).
New Relic Thread Profiling & CodeStream IDE Integration
New Relic provides thread profiling primarily through its runtime language agents (Java, .NET, Python, Ruby). Rather than continuous, 24/7 system-wide eBPF profiling, New Relic historically operated on demand: engineers initiate a "Thread Profile session" (e.g., 5 to 10 minutes) during an incident to sample JVM or CLR stack traces.
Where New Relic excels, however, is developer IDE integration via New Relic CodeStream. CodeStream bridges production telemetry directly into VS Code, IntelliJ, and GitHub pull requests. A developer working in their local editor can view production error stack traces, telemetry metrics, and code authorship annotations directly alongside the relevant lines of source code. However, for continuous, fleet-wide, low-overhead CPU and memory flamegraphs, Grafana Pyroscope is technically superior.
8. Kubernetes & Cloud-Native Observability: Grafana Alloy vs New Relic Operator
In modern containerized infrastructure running on Amazon EKS, Google GKE, or Azure AKS, the DaemonSet footprint of your observability agents directly impacts node capacity and cluster stability. In a 500-node cluster, heavy agent memory consumption wastes tens of thousands of dollars in EC2 compute every year.
Grafana Alloy: The Unified OpenTelemetry-First Telemetry Collector
In 2024–2026, Grafana consolidated its telemetry collectors (Grafana Agent, Promtail, and OpenTelemetry Collector integrations) into Grafana Alloy. Alloy is an OpenTelemetry-native telemetry collector built with a declarative, block-based Flow configuration language. It handles Prometheus scraping, OTLP metric/trace/log ingestion, Loki log tailing, and Pyroscope profiling inside a single lightweight Go process:
grpc { endpoint: "0.0.0.0:4317" }
http { endpoint: "0.0.0.0:4318" }
output {
metrics: [otelcol.processor.batch.default.input],
traces: [otelcol.processor.batch.default.input],
logs: [otelcol.processor.batch.default.input],
}
}
otelcol.processor.batch "default" {
timeout: "1s"
send_batch_size: 8192
output {
metrics: [otelcol.exporter.otlp.mimir.input],
traces: [otelcol.exporter.otlp.tempo.input],
}
}
Grafana Alloy typically runs with a steady-state footprint of 120MB to 220MB of RAM per worker node, consuming under 1.5% of a CPU core under heavy telemetry loads.
New Relic Kubernetes Operator & Pixie eBPF
New Relic's Kubernetes deployment utilizes the nri-bundle Helm chart, orchestrating the Infrastructure Agent, kube-state-metrics scraper, Prometheus open-metrics collector, and Pixie (an open-source eBPF protocol-tracing platform integrated into New Relic).
Pixie captures network packets, HTTP/gRPC requests, and raw SQL queries directly at the kernel boundary without application modification. However, because Pixie maintains an in-memory ring buffer on every worker node to store high-frequency telemetry for live debugging, the New Relic DaemonSet bundle routinely demands 250MB to 450MB of RAM per worker node. For clusters running dense, small pods on memory-constrained nodes, Alloy offers a lighter, more predictable resource profile.
9. Pricing Mechanics & FinOps Analysis: Seat Tax vs Active Series Surcharges
The economic divergence between New Relic and Grafana Cloud is the primary battlefield for FinOps practitioners. While New Relic anchors its billing on user seats and flat gigabyte ingestion, Grafana Cloud operates on a pure consumption model with near-zero seat licensing friction.
The New Relic Pricing Model: Seat Taxation & Gigabyte Ingestion
New Relic bills across two primary vectors:
- Data Ingestion: $0.30 per GB for Standard Edition (30-day retention). For Data Plus (90-day retention, HIPAA/FedRAMP eligibility, streaming export), the rate rises to $0.50 per GB. The first 100 GB per month is free.
- User Seat Licensing:
- Basic Users: Free. Unlimited read-only access to standard dashboards and alerts.
- Core Users: $49 per user/month. Access to telemetry data, query builders, and logs, but excluded from APM deep diagnostics.
- Full Platform Users: $99/mo (Standard), $199/mo (Pro with annual commit), or $349/mo (Enterprise with annual commit). Full Platform Users are required to inspect APM root cause analysis, distributed tracing details, serverless execution traces, and vulnerability management.
The FinOps Conflict: For an engineering department with 150 developers, granting everyone a Full Platform Enterprise seat costs $52,350 per month ($628,200 annually) before ingesting a single gigabyte of data. Consequently, enterprises routinely establish gatekeeping policies, rationing Full Platform seats to 20 SREs and forcing the remaining 130 developers into read-only tiers. During production incidents, this creates severe organizational friction.
Grafana Cloud Pricing Model: Democratized Seats & Usage Dimensions
Grafana Cloud inverts this structure by commoditizing seats and billing purely on consumed telemetry units:
- User Seats: Grafana Cloud Pro costs a baseline $19/month (includes 1 Pro seat). Additional Pro seats cost just $8 per user/month. Viewer users are completely free and unlimited. Granting 150 developers full Pro access costs just $1,211 per month ($14,532/year)—a 97% reduction in seat licensing fees compared to New Relic Enterprise.
- Active Metrics Series: First 10,000 active series free. Overage is billed at $8.00 per 10,000 active series per month (includes 13 months retention).
- Logs: First 50 GB free. Overage billed at $0.50 per GB ingested (includes 30 days retention).
- Traces: First 50 GB free. Overage billed at $0.50 per GB ingested (includes 30 days retention).
- Continuous Profiles: First 50 CPU cores free. Overage billed at $8.00 per 100 CPU cores per month.
TCO_GrafanaCloud = ($19 + (Extra_Seats × $8)) + (Series_Over_10k × $0.0008) +
((Logs_GB - 50) × $0.50) + ((Traces_GB - 50) × $0.50) +
(Profile_Cores_Over_50 × $0.08)
10. Quantitative 3-Year FinOps TCO Simulation (50, 250 & 1,200 Node Workloads)
To provide engineering executives and FinOps analysts with empirical, audit-grade financial clarity, our research lab modeled a rigorous 3-year Total Cost of Ownership (TCO) simulation across three realistic enterprise workload profiles.
Scenario A: High-Growth Kubernetes Startup (50 Worker Nodes / 25 Engineers)
Workload Parameters: 50 EKS nodes (16GB RAM), 25 software engineers needing APM diagnostics, 1,500 GB logs/month, 80,000 active Prometheus series, 500 GB traces/month, 100 profiled CPU cores.
| Cost Component | New Relic (Standard / Pro) | Grafana Cloud (Pro) |
|---|---|---|
| Seat Licensing Fee | 25 Full Users × $199 = $4,975 / mo | $19 base + (24 × $8) = $211 / mo |
| Data Ingestion (Logs + Traces + Metrics) | (2,000 GB - 100 GB) × $0.30 = $570 / mo | Logs: $725 | Traces: $225 = $950 / mo |
| Active Metrics Series | Included in gigabyte ingestion fee | (80k - 10k) = 70k series = $56 / mo |
| Continuous Profiling (100 Cores) | Thread profiling included in seat license | (100 - 50) cores = $4 / mo |
| Monthly Total Cost | $5,545 / month | $1,221 / month |
| 3-Year Cumulative TCO | $199,620 | $43,956 (Grafana saves $155,664 / 78%) |
Scenario B: Scale-Up Mid-Market Platform (250 Worker Nodes / 75 Engineers)
Workload Parameters: 250 GKE/EKS worker nodes (32GB RAM), 75 engineers, 12 TB logs/month, 600,000 active Prometheus series, 4 TB traces/month, 500 profiled CPU cores.
| Cost Component | New Relic (Enterprise Tier) | Grafana Cloud (Advanced / Pro) |
|---|---|---|
| Seat Licensing Fee | 75 Full Users × $349 = $26,175 / mo | $19 base + (74 × $8) = $611 / mo |
| Data Ingestion (Logs + Traces + Metrics) | (16,000 GB - 100 GB) × $0.30 = $4,770 / mo | Logs: $5,975 | Traces: $1,975 = $7,950 / mo |
| Active Metrics Series | Included in gigabyte ingestion fee | (600k - 10k) = 590k series = $472 / mo |
| Continuous Profiling (500 Cores) | Included in seat licenses | (500 - 50) cores = $36 / mo |
| Monthly Total Cost | $30,945 / month | $9,069 / month |
| 3-Year Cumulative TCO | $1,114,020 | $326,484 (Grafana saves $787,536 / 71%) |
Scenario C: Global Multi-Cloud Enterprise (1,200 Worker Nodes / 350 Engineers)
Workload Parameters: 1,200 multi-cloud nodes, 350 engineers, 120 TB logs/month, 4,000,000 active series, 35 TB traces/month, 2,500 profiled CPU cores. (Includes enterprise volume discounting).
| Cost Component | New Relic (Enterprise Negotiated) | Grafana Cloud (Enterprise Commit) |
|---|---|---|
| Seat Licensing Commitment | 350 Seats (Discounted to $240/mo) = $84,000 / mo | Enterprise platform license = $2,800 / mo |
| Data Ingestion (155 TB Telemetry) | 155,000 GB @ negotiated $0.22/GB = $34,100 / mo | Logs ($0.35/GB) + Traces ($0.35/GB) = $54,250 / mo |
| Active Metrics Series (4M Series) | Included in gigabyte ingestion fee | Negotiated pool ($5/10k series) = $2,000 / mo |
| Continuous Profiling (2,500 Cores) | Included | $160 / mo |
| Monthly Total Cost | $118,100 / month | $59,210 / month |
| 3-Year Cumulative TCO | $4,251,600 | $2,131,560 (Grafana saves $2,120,040 / 50%) |
FinOps Takeaway: The financial inflection point between New Relic and Grafana Cloud is overwhelmingly driven by headcount ratio to data volume. Because New Relic charges heavily per engineer ($99 - $349/month), organizations with large developer teams achieve massive 50% to 78% TCO savings by migrating to Grafana Cloud. Conversely, if an organization has very few engineers managing enormous petabyte-scale log streams with high cardinality, New Relic's flat $0.30/GB ingestion can become financially competitive.
11. Comprehensive 25-Row Enterprise Comparison Matrix
This 25-point technical and economic evaluation framework aggregates real-world benchmarks, telemetry ingestion limits, architectural capabilities, and licensing policies across New Relic and Grafana Cloud for enterprise architects.
| Architectural & Commercial Dimension | New Relic (Telemetry Data Platform) | Grafana Cloud (Managed LGTM) | Architectural Verdict & Trade-off |
|---|---|---|---|
| 1. Primary Architecture & Data Model | NRDB: Monolithic distributed columnar event store (schema-on-read) | LGTM Stack: Decoupled microservices (Mimir, Loki, Tempo, Pyroscope) on object storage | Architectural split: Turnkey unified lake vs modular open-source engine |
| 2. Metrics Storage & Ingestion Format | Dimensional metrics mapped into event records; Prometheus remote-write supported | Prometheus time series native; Cortex/Mimir chunk store with hash ring sharding | Grafana Cloud: Native Prometheus & OpenTelemetry metric standards |
| 3. Primary Query Languages | NRQL (SQL-like declarative query language for all telemetry types) | PromQL (Metrics), LogQL (Logs), TraceQL (Distributed Traces) | NRQL is simpler & unified; PromQL/LogQL/TraceQL offer specialized precision |
| 4. High-Cardinality Dimensions | High cardinality handled natively in columnar partitions without series multiplier fees | Label explosions multiply active series ($8 per 10k series); requires Adaptive Metrics | New Relic: Superior handling of dynamic UUIDs and transactional metadata |
| 5. Distributed Tracing Protocol | OpenTelemetry OTLP + New Relic proprietary trace agents; Infinite Tracing cloud tail-sampling | Native OpenTelemetry OTLP + Jaeger/Zipkin; Tempo stores traces in Apache Parquet | Grafana Cloud: 100% open-source standard with zero proprietary trace locks |
| 6. Log Aggregation & Indexing Model | Full event indexing in NRDB columnar store; $0.30/GB ingest with real-time stream search | Index-free label indexing with snappy chunk compression; Bloom filters in Loki 3.x | Loki is cheaper for massive volume; NRDB faster for arbitrary unindexed field search |
| 7. Continuous Profiling Capabilities | Thread profiling via language agents + CodeStream IDE integration; limited eBPF | Grafana Pyroscope: Zero-overhead system-wide eBPF continuous profiling + flamegraphs | Grafana Cloud: Pyroscope offers superior runtime CPU/memory flamegraph analytics |
| 8. Kubernetes Agent & Collector | New Relic K8s Operator + Pixie eBPF protocol tracer (250MB - 450MB RAM/node) | Grafana Alloy (Flow syntax) / Prometheus Operator (120MB - 220MB RAM/node) | Grafana Cloud: Alloy is lighter, unified, and standard OpenTelemetry-native |
| 9. Synthetic Monitoring | New Relic Synthetics: Multi-location ping, API, and scripted headless Chrome runners | Grafana Synthetic Monitoring: Blackbox exporter + k6 cloud integration | Tie: New Relic has richer UI workflows; Grafana k6 excels at code-defined load tests |
| 10. Real User Monitoring (RUM) & Mobile | Comprehensive browser agent + native iOS/Android SDKs + crash analytics | Grafana Cloud Frontend (Faro Web SDK); mobile APM requires external OpenTelemetry | New Relic: Vastly superior turnkey browser, mobile, and user session replay |
| 11. Serverless & Lambda Observability | AWS Lambda Layers + OpenTelemetry wrapper; cold start & invocation tracking | OpenTelemetry Lambda Layers sending OTLP directly to Grafana Cloud endpoints | New Relic: Turnkey serverless console with automated distributed trace stitching |
| 12. Alerting & Flapping Suppression | New Relic Alerts: NRQL alert conditions, muting rules, and AIOps correlation | Grafana Alerting: Prometheus alertmanager-compatible rules + contact points | New Relic: Superior automated anomaly detection; Grafana: GitOps-friendly Alertmanager |
| 13. AIOps & Root Cause Analysis | New Relic AIOps: Automated incident correlation, noise reduction, and generative AI chat | Grafana Incident + Sift + Machine Learning: Metric outlier detection & investigation | New Relic: More mature automated root cause correlation and alert clustering |
| 14. OpenTelemetry (OTel) Support | OTLP/HTTP & OTLP/gRPC ingestion into NRDB; maps OTel semantic conventions | Native first-class citizen across all components; Grafana Alloy is an OTel distribution | Grafana Cloud: True open-source OTel alignment without vendor translation layers |
| 15. Dashboarding & Data Visualization | New Relic One visual canvas: responsive widgets, pre-built APM views, NRQL charts | Grafana: World-class de facto standard visual dashboarding with limitless panels | Grafana Cloud: The gold standard for data visualization and custom dashboards |
| 16. Third-Party Plugin Ecosystem | New Relic Instant Observability: 500+ pre-built integrations and dashboards | Grafana Plugins: 300+ data source plugins (federate AWS, Azure, Datadog, Snowflake) | Grafana Cloud: Ability to query external data sources without ingestion lock-in |
| 17. Base Ingestion Pricing Structure | Flat $0.30/GB standard data ($0.50/GB Data Plus); includes logs, metrics, traces | Metrics: $8/10k series; Logs: $0.50/GB; Traces: $0.50/GB; Profiles: $8/100 cores | New Relic: Simpler flat gigabyte pricing; Grafana: Granular multi-sku billing |
| 18. User Seat Pricing & Friction | Full Platform: $99-$349/user/month; Core: $49/mo; Basic: Free (severe seat tax) | Pro: $19/mo base + $8/extra Pro seat; Free unlimited Viewers (zero seat friction) | Grafana Cloud: Democratizes access across entire engineering organizations |
| 19. Free Tier Generosity | 100 GB/month free data ingestion + 1 Full Platform User forever | 10k active series, 50GB logs, 50GB traces, 50GB profiles + 3 users forever | Tie: Both offer outstanding free tiers; Grafana's multi-telemetry quotas excel |
| 20. On-Premises / Hybrid Parity | SaaS-only multi-tenant cloud (NRDB cannot run self-hosted or air-gapped) | Full open-source parity: Loki, Mimir, Tempo, Pyroscope run anywhere on-prem | Grafana Cloud: Complete escape hatch to self-hosted OSS or Grafana Enterprise |
| 21. Security & Regulatory Compliance | SOC 2 Type II, ISO 27001, FedRAMP Moderate Authorized, HIPAA BAA (Data Plus) | SOC 2 Type II, ISO 27001, FedRAMP Moderate Authorized, HIPAA BAA | Tie: Both offer enterprise-grade compliance and healthcare/government tiers |
| 22. Data Retention Policies | Standard: 30 days retention; Data Plus: 90 days retention; extended archives extra | Metrics: 13 months; Logs: 30 days; Traces: 30 days; Profiles: 30 days (Pro defaults) | Grafana Cloud: Standard 13-month metric retention without expensive surcharges |
| 23. RBAC & Multi-Tenancy Engine | Sub-accounts and RBAC roles; cross-account NRQL querying | Organizations, teams, folder permissions, and datasource-level access controls | Grafana Cloud: Highly granular folder and team-level access governance |
| 24. Agent Kubernetes Node Memory | 250MB – 450MB RAM per worker node (Infrastructure + Pixie eBPF) | 120MB – 220MB RAM per worker node (Grafana Alloy unified collector) | Grafana Cloud: Lower node footprint frees cluster compute for workloads |
| 25. Vendor Lock-In & Portability | High: NRQL queries, proprietary agent configurations, and closed storage engine | Near Zero: Open-source PromQL, LogQL, TraceQL, OpenTelemetry, and S3 export | Grafana Cloud: Total telemetry portability and zero proprietary lock-in |
12. Enterprise Security, Governance, Compliance & Data Sovereignty
In highly regulated verticals—such as financial technology, healthcare, and public sector governance—telemetry pipelines carry sensitive payload metadata, requiring robust data governance, role-based access control (RBAC), and verifiable compliance certifications.
New Relic Security Architecture
- Compliance Standards: SOC 2 Type II, ISO 27001, FedRAMP Moderate Authorized, and HIPAA BAA availability (via Data Plus tier).
- Edge Obfuscation: Telemetry SDKs include configurable regex masking to scrub credit card numbers (PCI-DSS), Social Security numbers, and auth headers before leaving the host network.
- Deployment Topology: Strictly multi-tenant SaaS. NRDB cannot be executed self-hosted in on-premises or air-gapped data centers. Telemetry egress to New Relic cloud regions (US or EU) is mandatory.
Grafana Cloud Security & Hybrid Sovereignty
- Compliance Standards: SOC 2 Type II, ISO 27001, FedRAMP Moderate Authorized, and HIPAA BAA available for dedicated instances.
- Data Governance: Fine-grained RBAC with organization-level, folder-level, and datasource-level permissions, alongside SAML/SCIM automation.
- Hybrid & Air-Gapped Parity: The definitive strategic advantage of Grafana. Organizations subject to strict data sovereignty (defense contractors, sovereign banking) can deploy self-hosted Grafana Enterprise / Mimir / Loki inside isolated VPCs or air-gapped data centers while maintaining total feature and dashboard parity with Grafana Cloud.
13. Migration Blueprints & Coexistence Strategies: Dual-Ship Telemetry
Transitioning an established enterprise from New Relic to Grafana Cloud—or vice versa—requires a non-disruptive, phased migration strategy. Ripping out proprietary agents overnight introduces catastrophic blind spots. The proven architectural methodology is telemetry dual-shipping via the OpenTelemetry Collector.
Dual-Shipping Pipeline via OpenTelemetry Collector
By deploying an internal OpenTelemetry Collector DaemonSet or gateway cluster, engineering teams route identical application spans and metrics simultaneously to both New Relic and Grafana Cloud. This allows SREs to rebuild dashboards, tune PromQL alert thresholds, and train developers on Grafana without terminating existing New Relic SLAs:
otlp:
protocols:
grpc: { endpoint: "0.0.0.0:4317" }
http: { endpoint: "0.0.0.0:4318" }
processors:
batch: { timeout: "1s", send_batch_size: 8192 }
memory_limiter: { check_interval: "1s", limit_percentage: 75, spike_limit_percentage: 20 }
exporters:
# Destination 1: New Relic OTLP/HTTP Gateway
otlphttp/newrelic:
endpoint: "https://otlp.nr-data.net:4318"
headers:
api-key: "${env:NEW_RELIC_LICENSE_KEY}"
# Destination 2: Grafana Cloud OTLP/gRPC Gateway
otlp/grafanacloud:
endpoint: "tempo-prod-04-prod-us-east-0.grafana.net:443"
auth:
authenticator: basicauth/grafana
service:
pipelines:
traces:
receivers: [otlp]
processors: [memory_limiter, batch]
exporters: [otlphttp/newrelic, otlp/grafanacloud]
metrics:
receivers: [otlp]
processors: [memory_limiter, batch]
exporters: [otlphttp/newrelic, otlp/grafanacloud]
4-Phase Migration Roadmap
- Phase 1 (Standardize Instrumentation): Decouple code from New Relic proprietary SDKs by wrapping services with OpenTelemetry API/SDKs. Deploy the OpenTelemetry Collector DaemonSet.
- Phase 2 (Dual-Shipping & Validation): Enable parallel export to both New Relic and Grafana Cloud. Validate that metric rates, latency percentiles, and error counts match across both platforms.
- Phase 3 (Dashboard & Alert Porting): Recreate critical golden signal dashboards in Grafana. Port NRQL alerting logic into Prometheus Alertmanager rules in Grafana Cloud Alerting.
- Phase 4 (License Deprovisioning): Decommission the New Relic exporter pipeline, cancel Full Platform user licenses, and transition full production operations to Grafana Cloud, capturing immediate 50%+ FinOps savings.
14. Frequently Asked Questions (FAQ)
José Andrade
Systems Architect & FinOps ModelerFounder and Managing Editor at CloudBizStack. José specializes in distributed systems observability, Kubernetes resource topologies, and quantitative FinOps TCO models across enterprise cloud providers.