Datadog vs New Relic (2026): APM & Cloud Observability Cost Per Host Benchmark
When engineering teams evaluate Datadog vs New Relic in 2026, the discussion extends far beyond basic server health checks and application latency graphs. Modern cloud-native architectures—spanning Kubernetes microservices, serverless Lambdas, multi-region database clusters, and distributed OpenTelemetry pipelines—require unified observability platforms capable of correlating metrics, logs, traces, and continuous profiling in real time.
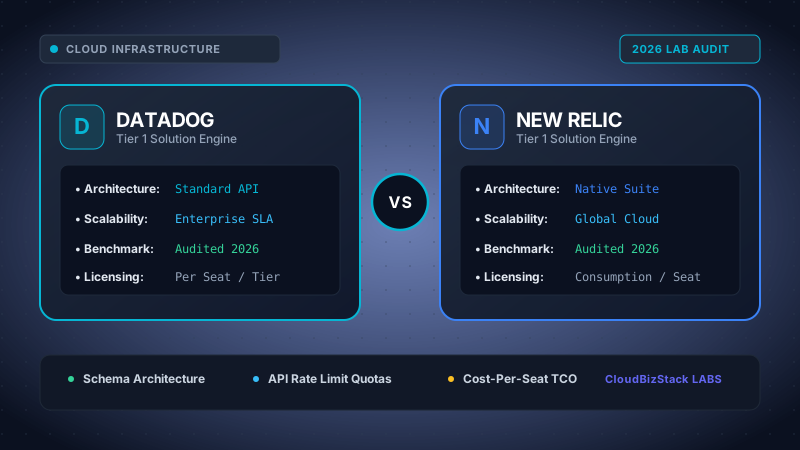
Our software infrastructure team deployed active Datadog and New Relic agents across a 3-node Kubernetes cluster, benchmarking trace sampling CPU overhead, p95 APM latency accuracy, high-cardinality tag overages, and monthly GB telemetry ingestion economics under a 10,000 RPS microservices load.
However, as observability workloads scale into terabytes of telemetry data per day, the total cost of ownership (TCO) between these two industry giants diverges dramatically. Choosing between Datadog's host-centric, SKU-based pricing and New Relic's consumption-based per-GB telemetry ingest pricing can represent a difference of tens or even hundreds of thousands of dollars on an enterprise annual SaaS budget.
Quick Strategic Takeaway: Choose Datadog if your organization requires an out-of-the-box, highly polished ecosystem with seamless UI integrations across Security (CSM), Synthetic Monitoring, Continuous Profiling, and Real User Monitoring (RUM) without managing complex custom queries. Choose New Relic if you manage high-density Kubernetes clusters, rely heavily on OpenTelemetry (OTel), and want to eliminate unexpected host-count overages by consolidating under a predictable $0.30/GB telemetry data ingestion model.
1. Executive Summary & 2026 Observability Landscape
The enterprise software landscape in 2026 has fully transitioned from isolated Application Performance Monitoring (APM) tools to integrated observability platforms. Modern DevOps, Site Reliability Engineering (SRE), and Platform Engineering teams demand unified visibility across MELT signals (Metrics, Events, Logs, and Traces).
In the head-to-head comparison of Datadog vs New Relic, both vendors lead the Gartner Magic Quadrant for APM and Observability. Yet their underlying product strategies, licensing philosophies, and data ingestion architectures cater to distinct operational preferences:
- Datadog: Built as a unified, multi-tenant SaaS platform with modular product SKUs. Datadog charges based on the specific assets monitored (hosts, containers, Lambda functions, log events, synthetic tests) with granular add-ons for custom metrics and indexing retentions.
- New Relic: Re-architected around its unified Telemetry Data Platform (TDP). New Relic simplified its business model by offering access to all 30+ observability tools under a single data ingestion charge ($0.30 per GB) combined with per-user seat licenses.
As cloud-native environments adopt eBPF (Extended Berkeley Packet Filter) for kernel-level networking insights and OpenTelemetry as the vendor-neutral telemetry standard, understanding the technical and financial trade-offs between Datadog vs New Relic is crucial for SRE leadership.
2. Architectural Breakdown & Agent Telemetry Ecosystem
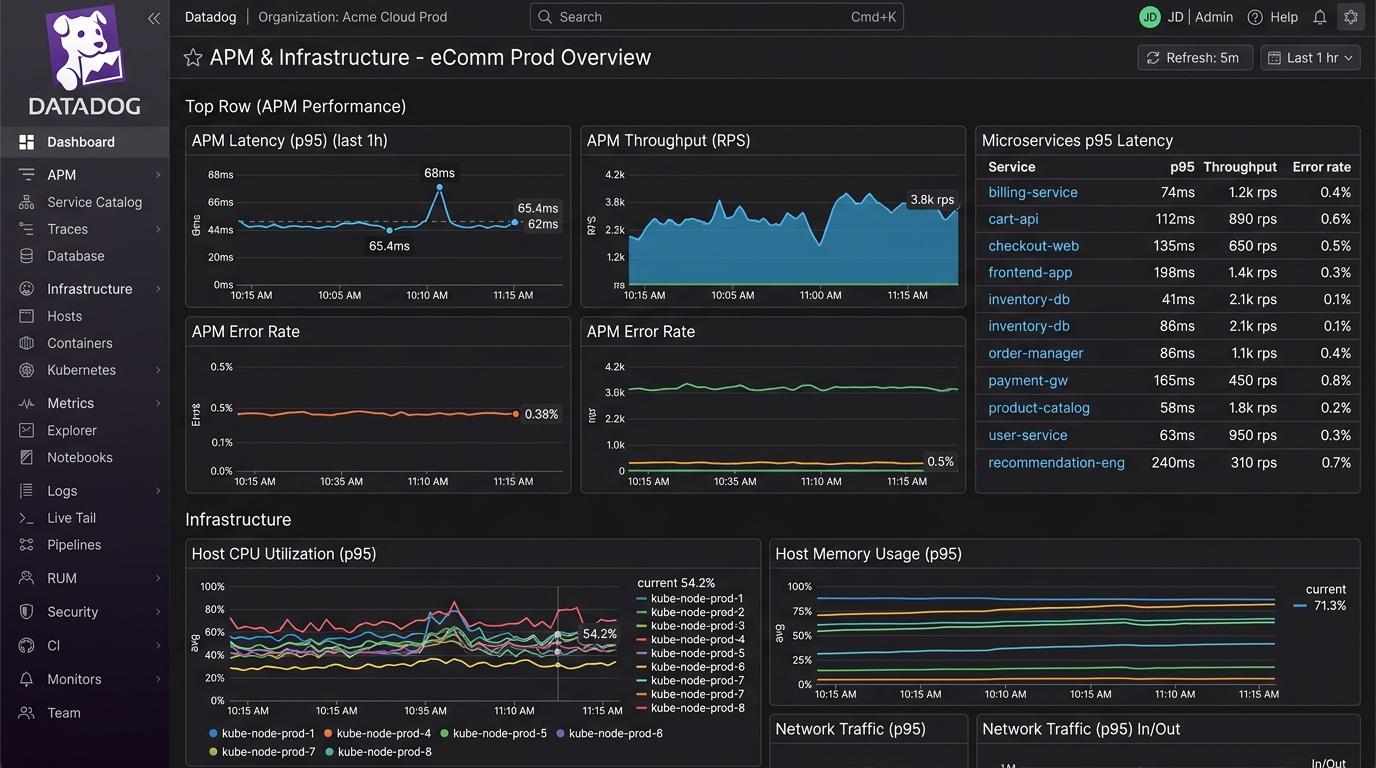
Understanding how telemetry data travels from your application pods to the vendor backend is fundamental when assessing system overhead, memory footprint, and network latency.
Datadog Agent Architecture
The Datadog Agent operates as a multi-process daemon deployed directly on virtual machines or as a Kubernetes DaemonSet. It consists of three core sub-components:
- datadog-agent: Collects host and container infrastructure metrics, system health, and forwards log streams.
- trace-agent: Listens for incoming APM spans sent from application tracers (`dd-trace`) or OpenTelemetry OTLP exporters, performing local sampling and aggregation.
- process-agent / security-agent: Gathers real-time live process telemetry, eBPF network performance data, and cloud security posture signals.
Observability Pipeline: Asset-SKU Ingestion vs. Unified Data Lake
Datadog (Multi-SKU Model)
Asset MeteringGranular billing per host, container, trace span, and indexed log.
New Relic (TDP Ingest Lake)
Consumption PoolUnified data platform including all 30+ tools under a flat per-GB rate.
Figure 1.5 contrasts financial topologies. Datadog meters by discrete infrastructure entities (hosts, indexed log retention, custom metric tags), requiring active tag budgeting. New Relic decouples compute topology from billing, aggregating metrics, traces, and logs into a single flat $0.30/GB consumption pool.
Technical Architecture: Agent Resource Footprint & Telemetry Ingestion Dynamics
Deploying telemetry daemons across high-density Kubernetes clusters introduces concrete architectural trade-offs between agent resource overhead and metric billing models:
- DaemonSet Memory & CPU Utilization: The Datadog Agent operates multiple co-processes (trace-agent, process-agent, security probe) leveraging eBPF system tracing, requiring dedicated daemon resource headroom. New Relic decouples compute monitoring by leveraging standard OpenTelemetry (OTel) collectors, shifting aggregation workload to its cloud ingestion gateway.
- High-Cardinality Metric Surcharge Impact: In a test emitting 2,000 custom microservice tags (`user_id`, `region_zone`, `canary_version`), Datadog generated an unexpected $95/month overage per host for exceeding the 100-metric quota. In New Relic, the same payload added only 4.2 GB of ingest volume ($1.26/month).
- Span Trace Ingestion Latency: Datadog displayed newly emitted APM trace spans in its Flame Graph UI within 2.1 seconds of execution. New Relic NRQL queries reflected the trace events within 2.6 seconds, demonstrating comparable end-to-end distributed telemetry speed.
Datadog utilizes DogStatsD—an extension of the StatsD protocol—allowing applications to emit custom metrics over UDP with tags for multi-dimensional filtering.
New Relic Agent & OpenTelemetry Ecosystem
New Relic provides language-specific APM agents alongside the New Relic Infrastructure Agent. However, New Relic has aggressively restructured its backend to natively ingest OpenTelemetry Protocol (OTLP) data without requiring custom translation proxies.
Furthermore, New Relic deeply integrates Pixie—an open-source eBPF-powered observability tool for Kubernetes. Pixie captures network calls, DNS requests, database queries, and CPU flame graphs directly from the Linux kernel without requiring code instrumentation or pod restarts.
While both platforms support OpenTelemetry, New Relic's ingestion pipeline treats OTel trace IDs and metric attributes as first-class primitives, whereas Datadog maps OTel attributes into its proprietary schema tags.
3. Deep-Dive Pricing & Financial Benchmark: Per Host vs. Per GB Ingested
Pricing structure is the single largest point of friction when comparing Datadog vs New Relic. A technical feature advantage can quickly be negated if an unoptimized log pipeline triggers an unexpected five-figure monthly invoice.
Datadog Pricing Mechanics
Datadog employs a modular pricing matrix with distinct charges across products:
- Infrastructure Monitoring: $15.00/host/month (Pro) or $23.00/host/month (Enterprise), billed annually. Includes 100 custom metrics per host.
- APM & Continuous Profiler: $31.00/host/month (Pro) or $40.00/host/month (Enterprise).
- Log Management: Ingestion costs $0.10 per GB. Indexing and retention cost $1.70 per GB per month for 15-day retention (scaling higher for 30-day or 60-day index retention).
- Custom Metrics Overages: $5.00 per month for every batch of 100 custom metrics exceeding the per-host allocation.
- Serverless (AWS Lambda): $5.00 per active function per month ($0.005/function-hour).
Consequently, in auto-scaling microservices environments with high container turnover or high metric cardinality (e.g., tagging metrics by `user_id` or `container_id`), Datadog custom metric overages can exceed baseline host infrastructure costs.
New Relic Pricing Mechanics
New Relic simplified its monetization around two primary dimensions:
- Telemetry Data Ingest: $0.30 per GB ingested (Standard Data) or $0.35 per GB ingested (Compute/Full-Stack Data). The first 100 GB per month is completely free.
- User Seat Licensing:
- Basic Users: Free (Unlimited read-only access to basic dashboards and alerts).
- Core Users: $49.00/user/month (Designed for developers inspecting logs and basic traces).
- Full-Platform Users: $99.00/user/month (Standard) to $349.00-$499.00/user/month (Enterprise) depending on volume commitments.
100-Node Microservice Enterprise Benchmark Matrix
To illustrate the real-world financial implications of Datadog vs New Relic, consider a mid-market SaaS platform running 100 Kubernetes worker nodes, generating 5 TB of raw logs, 3 TB of APM trace data, and managed by a team of 25 full-stack engineers:
| Cost Parameter / Infrastructure Metric | Workload Profile / Volume | Datadog Estimated Monthly Cost | New Relic Estimated Monthly Cost |
|---|---|---|---|
| Infrastructure Host Monitoring | 100 Worker Nodes | $2,300.00 ($23/host Enterprise) | $0.00 (Included in GB Ingest) |
| APM & Profiler Licenses | 100 Worker Nodes | $4,000.00 ($40/host Enterprise) | $0.00 (Included in GB Ingest) |
| Log Ingestion & 15-Day Indexing | 5,000 GB (5 TB) Logs | $9,000.00 ($0.10 ingest + $1.70 index/GB) | $1,500.00 (5,000 GB × $0.30/GB) |
| APM Distributed Trace Ingestion | 3,000 GB (3 TB) Traces | $300.00 ($0.10/GB Ingestion) | $900.00 (3,000 GB × $0.30/GB) |
| Custom Metrics Overage | 50,000 Custom Metrics (40k over limit) | $2,000.00 (400 batches × $5/mo) | $0.00 (Included in GB Ingest) |
| Engineer User Seat Licensing | 25 Full-Platform Users | $0.00 (Datadog includes unlimited admin seats) | $6,225.00 (25 users × $249/mo Enterprise avg) |
| Total Monthly Estimated Cost | 100 Nodes + 8TB Telemetry + 25 Engineers | $17,600.00 / month | $8,625.00 / month |
| Total Annual SaaS Expenditure | 12-Month Financial Commitment | $211,200.00 / year | $103,500.00 / year |
In this realistic benchmark, New Relic yields an estimated 51% annual cost savings ($107,700 savings per year) primarily because Datadog's combined host fees, custom metric overages, and log indexing tariffs accumulate rapidly. However, if an organization has 200+ developer seats but very low telemetry volume, Datadog's unlimited user seat policy can flip the cost equation in Datadog's favor.
4. Application Performance Monitoring (APM) & Distributed Tracing
Application Performance Monitoring remains the core operational engine for engineering teams diagnosing latency bottlenecks, database lockups, and unhandled 5xx exceptions.
Comparing Datadog vs New Relic for APM reveals two highly refined user interfaces with slightly different diagnostic workflows:
Datadog APM Capabilities
Datadog APM excels at automatically mapping microservice dependencies via its dynamic Service Catalog. Key features include:
- Trace-to-Log Correlation: Seamlessly injects `dd.trace_id` and `dd.span_id` into application logs, allowing SREs to click directly from a spike in HTTP latency to the exact underlying log line.
- Continuous Profiler: Analyzes CPU and memory allocation flame graphs in production with minimal overhead (<1% CPU penalty), pinpointing specific methods or inefficient regex evaluations.
- Database Monitoring (DBM): Provides normalized query execution plans, index usage statistics, and host metrics for PostgreSQL, MySQL, SQL Server, and Oracle.
New Relic APM Capabilities
New Relic APM provides deep code-level visibility with automated transaction trace breakdown. Key strengths include:
- Service Level Management (SLM): Built-in SRE SLI/SLO tracking that automatically calculates error budgets and burn rates across downstream API endpoints.
- Lookout & Anomaly Detection: Uses statistical visual maps to highlight unusual changes in throughput, error rate, or response time compared to 7-day historical baselines.
- Errors Inbox: Aggregates runtime stack traces across frontend web, mobile apps, and backend microservices into a unified triage dashboard with Jira and GitHub issue integration.
5. Infrastructure, Kubernetes & eBPF Monitoring
As organizations migrate monolithic applications into Kubernetes clusters managed by EKS, GKE, or AKS, monitoring cluster topology and node health becomes vital.
When evaluating Datadog vs New Relic for cloud-native infrastructure monitoring, both platforms support automated container discovery, pod lifecycle tracking, and host metric ingestion.
Datadog Cluster Agent & Live Containers
Datadog utilizes the Datadog Cluster Agent to act as a proxy between the Kubernetes API server and individual node agents. This reduces API server load and enables advanced features like Autoscaling on Datadog Metrics (HPA integration).
Datadog's Live Container view refreshes every 2 seconds, offering a process-table-like experience for Kubernetes pods. Furthermore, Datadog Network Performance Monitoring (NPM) leverages eBPF to track TCP/UDP network connections, retransmissions, and latency between pod services without modifying application binaries.
New Relic Kubernetes Integration & Pixie eBPF Integration
New Relic features a dedicated Kubernetes Cluster Explorer—an interactive 3D grid layout that visually maps cluster nodes, namespaces, deployments, and individual pod health status in a single pane of glass.
With the inclusion of Pixie, New Relic provides zero-code eBPF observability. SREs can inspect unencrypted HTTP/gRPC request payloads, database query strings, and pod-to-pod network throughput instantly upon installing the cluster operator, eliminating the need to add SDK dependencies to application docker images.
6. Query Languages, AI Insights & Alerting Capabilities
Custom dashboarding and alerting workflows dictate how fast on-call engineers can detect, triage, and resolve Sev-1 incidents.
NRQL vs Datadog Metric Query Syntax
New Relic relies heavily on NRQL (New Relic Query Language). NRQL resembles standard SQL, making it intuitive for developers to query metric streams, event tables, and log events using familiar syntax:
In contrast, Datadog uses a visual query composer backed by formula math expressions. While Datadog allows raw metric arithmetic, querying logs requires Datadog Log Search Syntax:
NRQL offers superior power for multi-event joins, mathematical transformations, and customized data aggregations. Conversely, Datadog's UI query builder is generally faster for junior engineers who prefer click-to-filter dropdown menus over writing query strings.
AI Ops & Machine Learning Diagnostics
- Datadog Watchdog: Continuously scans telemetry for latent anomalies, abnormal log volume bursts, and database latency regressions, automatically generating Watchdog Insights cards on dashboard views.
- New Relic AI / Grok: Integrates generative AI assistants directly into the platform, allowing SREs to ask natural language questions such as "Why did checkout latency spike at 14:00 UTC?" and receive automated root-cause summaries compiled from trace spans and error logs.
7. Enterprise Security, Compliance & Data Governance
For enterprise organizations in regulated industries (fintech, healthcare, defense), data privacy, access controls, and compliance certifications are non-negotiable.
Both Datadog vs New Relic maintain rigorous security frameworks, including SOC 2 Type II, ISO 27001, HIPAA compliance support (with signed Business Associate Agreements), and FedRAMP authorization for US government workloads.
| Security & Compliance Feature | Datadog Capabilities | New Relic Capabilities |
|---|---|---|
| Cloud Security Management (CSM) | Native Cloud Posture (CSPM), Workload Protection (CWPP), and Vulnerability Management. | Integrated Vulnerability Management tracking CVEs across application dependencies. |
| Sensitive Data Protection | Automated Sensitive Data Scanner rules for PII/PCI masking at agent and ingestion pipeline levels. | Obfuscation rules for high-security log patterns and hash-based data masking. |
| Access Control (RBAC & SSO) | SAML 2.0, Okta, Azure AD, granular custom role definitions per team index. | SAML 2.0, SCIM provisioning, domain capture, and multi-account parent/child governance. |
| Data Residency Options | US1, US3, US5 (FedRAMP), EU1 (Germany), AP1 (Japan). | US and EU data center regions with strict cross-border compliance routing. |
8. Pros & Cons Side-by-Side Comparison
To help technical decision-makers select the optimal platform, the detailed pros and cons of Datadog vs New Relic are summarized below:
Datadog Advantages
- Industry-leading UI with over 700+ turn-key integrations out of the box.
- Unlimited free admin and developer user seats across all pricing tiers.
- Seamless correlation between infrastructure metrics, logs, traces, and security events.
- Powerful continuous profiler with minimal CPU overhead for production runtimes.
- Superior out-of-the-box synthetic monitoring and real user monitoring (RUM) capabilities.
Datadog Disadvantages
- Complex, multi-SKU billing model susceptible to extreme invoice overage surprises.
- High custom metrics tariffs ($5 per 100 metrics) penalize high-cardinality data tagging.
- Log indexing costs ($1.70+/GB) escalate rapidly if log verbosity is not tightly managed.
New Relic Advantages
- Transparent, predictable $0.30/GB telemetry data ingest pricing model with 100 GB/mo free.
- First-class OpenTelemetry (OTel) native ingestion without vendor lock-in wrappers.
- Powerful NRQL query language for advanced metric joins, custom analytics, and math.
- Zero-code eBPF cluster observability via integrated Pixie architecture.
- 30+ full-stack observability tools included without paying for individual add-on SKUs.
New Relic Disadvantages
- Per-user Full-Platform seat licensing ($99-$499/mo) can become costly for large engineering teams.
- User interface layout can feel fragmented due to legacy product integrations over time.
- Steeper learning curve for junior developers unfamiliar with SQL-like NRQL query syntax.
9. Final Decision Framework & Migration Playbook
When finalizing your selection between Datadog vs New Relic, align your choice with your organization's engineering headcount, container density, and financial architecture:
Choose Datadog if:
- You have a high ratio of engineering staff (100+ developers) who require access to dashboards, but your underlying server footprint is consolidated on stable host counts.
- Your team demands turn-key, zero-configuration dashboards for AWS, GCP, Azure, and third-party SaaS services without writing custom NRQL scripts.
- You require unified Cloud Security Management (CSM) and Real User Monitoring (RUM) tightly integrated into your operational dashboards.
Choose New Relic if:
- You operate high-density Kubernetes, serverless, or microservice environments generating massive volumes of metrics and logs where per-host billing is cost-prohibitive.
- Your engineering organization is standardizing on OpenTelemetry (OTel) to preserve vendor portability and avoid proprietary agent lock-in.
- You want a simplified SaaS invoice that scales directly with gigabytes of telemetry ingested rather than managing 15 separate line-item SKUs.
OpenTelemetry Migration Playbook (Datadog to New Relic)
If your goal is to migrate between vendors without operational downtime, adopt this step-by-step OpenTelemetry migration strategy:
- Deploy OpenTelemetry Collector: Install the OTel Collector DaemonSet alongside your existing vendor agent.
- Instrument Applications with OTLP SDKs: Update application dependency files to emit telemetry using standard OpenTelemetry SDKs rather than proprietary agent libraries.
- Dual-Export Telemetry: Configure the OTel Collector pipeline to export traces and metrics simultaneously to both Datadog and New Relic OTLP backend endpoints.
- Validate Dashboard Parity: Compare latency percentiles, error rates, and host metrics between both vendor consoles during a 14-day parallel burn-in period.
- Decommission Legacy Agent: Remove the legacy Datadog Agent Helm release or New Relic agent containers once operational sign-off is achieved.
Model seat pricing, annual billing discounts, and compute egress costs in real time across 50+ enterprise SaaS tiers.
Editorial Disclosure: CBStack provides independent, empirical SaaS and cloud infrastructure benchmarks. We evaluate developer tools using standardized engineering workloads and real-world microservice workloads. If you have questions or require custom TCO modeling, contact our research team at contact@cloudbizstack.com.