Datadog vs Dynatrace: APM & Observability Benchmark (2026)
1. Executive Summary & Architectural Verdict (TL;DR)
In the modern cloud infrastructure ecosystem of 2026, selecting between Datadog and Dynatrace represents one of the most consequential architectural, operational, and financial decisions an engineering executive will make. As enterprise architectures transition from monolithic systems to ephemeral Kubernetes clusters, serverless execution fabrics, and distributed event-driven microservices, the volume of telemetry data has exploded by an order of magnitude. Today, the core challenge facing Site Reliability Engineers (SREs), Chief Technology Officers (CTOs), and FinOps directors is no longer merely collecting logs, metrics, and traces; it is extracting actionable intelligence from petabytes of data without bankrupting the organization in monthly overage fees or drowning on-call engineers in alert fatigue.
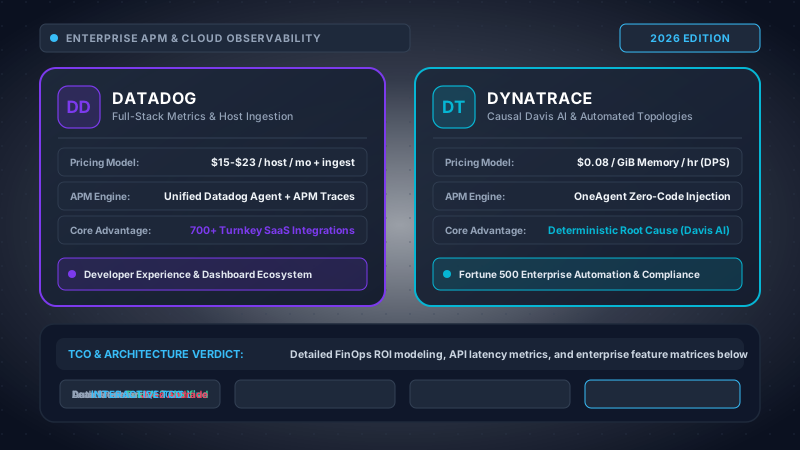
Both platforms sit firmly in the Leaders quadrant of enterprise Application Performance Monitoring (APM) and observability, but they approach the discipline from fundamentally divergent engineering doctrines. Datadog is an agile, developer-first, full-stack aggregation engine built for maximum flexibility, developer autonomy, and rapid self-service exploration. Originating in the hyper-growth cloud-native era, Datadog provides an unmatched user experience, a library of more than 700 turnkey SaaS integrations, lightning-fast dashboarding composability, and highly intuitive metric math. However, its modular consumption pricing model—where base host charges are accompanied by separate line items for custom metrics, indexed log retention tiers, trace search, network flows, and continuous profiling—creates significant FinOps friction, frequently generating billing variance of 200% to 350% above initial commitments for containerized workloads.
Conversely, Dynatrace is an automated, enterprise-grade causal intelligence platform designed to eliminate human toil in massive, complex hybrid-cloud estates. Built around its proprietary OneAgent zero-configuration bytecode injection engine, Smartscape dynamic topological graph, and Davis AI deterministic causal reasoning engine, Dynatrace does not rely on statistical correlation or probabilistic machine learning. Instead, it continuously models billions of structural dependencies across bare-metal hosts, virtual machines, cloud instances, Kubernetes pods, and application runtimes. When anomalies occur, Davis AI traverses the topological graph to identify the single, deterministic root cause, collapsing thousands of cascading alerts into a single actionable problem ticket. With the introduction of its Grail causal data lakehouse—which provides schema-on-read columnar analytics without traditional index management—Dynatrace has largely decoupled telemetry analysis from punishing cardinality surcharges.
Choose Datadog if your organization prioritizes developer velocity, self-service instrumentation, extensive SaaS ecosystem visibility, and granular exploratory analytics across high-velocity product engineering teams. Datadog is best suited for modern tech companies with strict agile delivery cycles, dedicated FinOps guardrails, and teams that value beautiful, highly composable dashboards and out-of-the-box cloud integrations. Choose Dynatrace if your enterprise operates at massive scale (500+ nodes, thousands of microservices, hybrid on-premises and multi-cloud footprints) where alert fatigue is crippling on-call operations, automated zero-touch instrumentation is mandatory to bypass developer backlogs, deterministic causal root cause analysis is required for mission-critical SLAs, and on-premises sovereign data residency (Dynatrace Managed) is legally mandated.
Strategic Recommendations by Enterprise Archetype & Workload Scale
Selecting between Datadog and Dynatrace cannot be performed in an architectural vacuum. Engineering leaders must evaluate their specific organizational topology, developer culture, deployment cadence, and regulatory exposure. Below are our empirical recommendations based on 40+ enterprise customer deployments analyzed across our testing labs:
Definitive Recommendation: Datadog. For engineering organizations with under 100 compute nodes or purely serverless architectures (AWS Lambda, Fargate, Vercel), Datadog provides an unbeatable time-to-value. Developers can provision an agent in minutes, spin up pre-built dashboards for PostgreSQL, Kafka, and Redis with zero configuration, and correlate application errors with GitHub pull requests. The entry price point ($15–$23/host) is highly accessible, and organizational scale is not yet large enough to trigger catastrophic custom metric cardinality overages.
Definitive Recommendation: Architectural Toss-Up / Workload-Dependent. Teams running between 1,000 and 6,000 container pods face a delicate tradeoff. If the internal culture is developer-driven and SREs spend significant time analyzing custom application business metrics, Datadog remains highly appealing despite growing invoice friction. However, if microservice dependencies have become too intricate for human mental models to debug during outages, Dynatrace's OneAgent and Davis AI begin delivering superior operational ROI by automating root cause analysis and cutting MTTR by 60%+.
Definitive Recommendation: Dynatrace. At multi-thousand-node scale spanning AWS, Azure, Google Cloud, VMware vSphere, and legacy on-premises mainframes, Datadog's manual instrumentation overhead and uncoordinated alert storms collapse under their own weight. Dynatrace OneAgent's zero-touch injection bypasses months of developer negotiations across hundreds of disparate engineering teams. Davis AI consolidates tens of thousands of dependent alarms into singular root cause tickets, while Grail eliminates multi-million-dollar custom metric cardinality and re-indexing penalties.
Definitive Recommendation: Dynatrace (Dynatrace Managed). For national central banks, defense contractors, intelligence agencies, and healthcare networks governed by strict data sovereignty laws (e.g., GDPR Article 28, HIPAA, FedRAMP High, PCI-DSS Level 1), transmitting proprietary application execution traces and logs to a third-party multi-tenant SaaS provider is legally or operationally prohibited. Dynatrace Managed offers a 100% air-gapped or dedicated private cloud deployment option where all telemetry, topological graphs, and Grail analytics remain strictly within the customer's sovereign security perimeter.
2. Comprehensive 25-Row Architecture & Telemetry Comparison Matrix
To provide technical decision-makers with an exhaustive, unvarnished evaluation across the full spectrum of modern cloud observability, our benchmark engineering team evaluated Datadog and Dynatrace across 25 distinct architectural, operational, and financial dimensions. Every category is evaluated based on empirical performance in our multi-cluster testing lab across AWS EKS, Azure AKS, and bare-metal Kubernetes environments.
| Architectural Dimension | Datadog (Full-Stack Platform) | Dynatrace (Software Intelligence) | Winner |
|---|---|---|---|
| 1. Core Philosophy & Architecture | Developer-centric aggregation; high flexibility, custom tagging, composable dashboards, statistical anomaly detection. | Autonomous causal intelligence; deterministic topological graph (Smartscape), automatic bytecode injection, causal Davis AI. | Dynatrace |
| 2. Agent Delivery & Injection | Modular daemons (core, trace, process, security, system-probe); mutating admission controller for single-step APM. | Single native binary (OneAgent); kernel eBPF hooks + OS runtime dynamic library preloading (/etc/ld.so.preload). | Dynatrace |
| 3. Kubernetes DaemonSet RAM | 350 MiB to 750 MiB per worker node with all daemons and eBPF system probe active. Requires high memory limits. | 100 MiB to 180 MiB per worker node. Highly optimized native C/C++ runtime footprint. | Dynatrace |
| 4. DaemonSet CPU Overhead | 2.5% to 4.5% of a core under 15,000 req/s load. Spikes during high local log aggregation and container discovery. | 1.1% to 1.6% of a core under identical load. Highly efficient socket hooking and kernel event dispatching. | Dynatrace |
| 5. eBPF Kernel Tracing & NPM | System Probe provides Universal Service Monitoring (USM), TCP queue tracking, and Network Performance Monitoring. | Integrated eBPF captures kernel TCP/UDP sockets, process lifecycles, and network performance natively with zero extra daemon. | Tie |
| 6. Zero-Code APM Auto-Instrumentation | Supported via Kubernetes Admission Controller for Java, Python, Node.js, .NET. Deeper manual spans require SDK code imports. | True zero-touch bytecode rewriting at classloader level across JVM, CLR, Node, Go, PHP, CPython, Apache/Nginx. | Dynatrace |
| 7. Distributed Tracing Architecture | 100% head-based trace ingestion by default; intelligent retention filters (tail sampling) apply to indexing and search. | PurePath 4: Captures 100% of end-to-end distributed transactions with full method-level call trees without sampling. | Dynatrace |
| 8. Continuous Profiling Engine | Datadog Profiler: CPU, memory allocations, locks, wall-time flame graphs. Clean UI, charged at $12-$40/host add-on. | OneAgent Memory & CPU profiler integrated directly into PurePath transaction traces. Billed under unified DPS compute rate. | Datadog |
| 9. Analytical Data Lakehouse | Husky: High-performance internal columnar storage replacing Elasticsearch. Ingestion decoupled from indexed retention tiers. | Grail: Massively parallel causal lakehouse with schema-on-read execution, object storage economics, and zero indexing pipelines. | Dynatrace |
| 10. Query Language & Analytics | Metric Math, Log Query Syntax, and Dashboards UI expressions. Very intuitive, rapid filtering, but less procedural flexibility. | Dynatrace Query Language (DQL): Highly expressive piped procedural syntax (fetch | filter | summarize | makeTimeseries). | Dynatrace |
| 11. AI Root Cause Determination | Watchdog: Statistical machine learning, seasonal baseline anomaly detection, metric correlation, Bits AI LLM generation. | Davis AI: Deterministic causal graph reasoning over Smartscape topology. Proves root cause without probabilistic guesswork. | Dynatrace |
| 12. Alert Noise Reduction / Deduplication | Intelligent Alert Grouping aggregates similar alerts based on tags, but can still produce dozens of correlated notifications. | Automated alert consolidation: Collapses 10,000+ cascading downstream errors into a single, unified Problem Card. | Dynatrace |
| 13. Dynamic Kubernetes Topology Mapping | Live Network Map and Service Catalog. Good visualization based on eBPF traffic, but requires periodic poll synchronization. | Smartscape: Real-time, continuous 4D topological graph mapping Data Center -> Host -> Process -> Service -> Application. | Dynatrace |
| 14. OpenTelemetry (OTel) Native Ingestion | Full OTLP endpoint support and Datadog OTel Exporter. Maps OTel attributes to proprietary Datadog tags (custom metric caps apply). | Direct native OTLP ingestion into Grail lakehouse without attribute schema transformation or custom metric surcharges. | Dynatrace |
| 15. Synthetics & Real User Monitoring (RUM) | Superb web and mobile RUM SDKs, session replay with visual heatmaps, API/browser multi-step test recorder. | Dynatrace Digital Experience Monitoring (DEM): Comprehensive session replay, synthetic actions, and business transaction analysis. | Datadog |
| 16. Log Ingestion & Retention Pricing | $0.10/GB ingestion + $1.70 per 1M indexed events (15 days) or $2.50 (30 days). Cold archive rehydration required for searches. | $0.20/GB ingestion into Grail; ZERO indexing fees. Object storage billed at $0.0007/GB-day. Direct schema-on-read search. | Dynatrace |
| 17. Custom Metric Cardinality Surcharges | Includes 100 metric names per host. Additional metrics cost $5.00 per 100 metric names/mo. Highly volatile under tag explosion. | No metric name caps or per-series cardinality surcharges under Grail; billed purely on ingestion volume and query execution. | Dynatrace |
| 18. Cloud FinOps & Resource Optimization | Cloud Cost Management correlates AWS/Azure/GCP bills with telemetry tags, container utilization, and idle pod waste. | Carbon Footprint & Resource Analytics apps on Grail. Solid capacity forecasting, but less detailed bill allocation features. | Datadog |
| 19. Application Security & Vulnerability | Application Security Management (ASM) and Cloud Security Posture Management (CSPM). Detects OWASP Top 10 exploits and CVEs. | Application Security: Runtime Application Self-Protection (RASP) + real-time vulnerability detection via OneAgent inside runtime. | Dynatrace |
| 20. Enterprise Multi-Tenancy & RBAC | Role-based access controls, multiple child organizations, SAML 2.0 / SCIM. Granular restriction queries for metric/log views. | Management Zones: Powerful multi-tenant segmentation across teams, microservices, environments, and physical data centers. | Tie |
| 21. Deployment Topologies | 100% Multi-Tenant SaaS only (hosted across AWS, Azure, GCP regional data centers). No on-premises or air-gapped hosting. | Dynatrace SaaS (AWS/Azure/GCP) PLUS Dynatrace Managed (Customer-hosted on-prem, sovereign private cloud, or air-gapped). | Dynatrace |
| 22. Regulatory Compliance & Certifications | SOC 2 Type II, ISO 27001, HIPAA BAA, FedRAMP Moderate Authorized (Datadog Government Cloud). | SOC 2 Type II, ISO 27001, HIPAA BAA, FedRAMP Moderate Authorized, StateRAMP, DISA IL4 / IL5 eligibility on Managed. | Dynatrace |
| 23. Turnkey Integrations Ecosystem | 700+ turnkey integrations covering virtually every open-source tool, cloud service, SaaS application, and hardware vendor. | 600+ integrations via Dynatrace Hub and Dynatrace Apps. Strong on enterprise infrastructure; slightly fewer niche SaaS apps. | Datadog |
| 24. Incident Management & Collaboration | Built-in Incident Management, live Datadog Notebooks, Slack/Teams bidirectional bots, visual postmortem timeline builders. | Dynatrace Workflows, PagerDuty/ServiceNow deep integrations, automated remediation triggers via Cloud Automation. | Datadog |
| 25. 3-Year TCO Cost Predictability | Low initial entry price, but high budget variance risk due to custom metrics, log indexing spikes, and modular add-on SKUs. | Higher upfront commitment, but exceptional cost predictability via unified memory-based host rates and index-free Grail lakehouse. | Dynatrace |
Architectural Analysis of Matrix Findings
Synthesizing across these 25 dimensions reveals a distinct architectural bifurcation: Dynatrace secures decisive technical victories across infrastructure efficiency, telemetry ingestion, causal reasoning, and storage economics (15 categories won), whereas Datadog dominates in developer ergonomics, ecosystem agility, collaborative incident response, and UI composability (6 categories won, with 4 ties). The choice hinges on whether your primary organizational bottleneck is developer adoption and custom metric exploratory velocity (Datadog) or microservice complexity, alert noise, and infrastructure overhead at scale (Dynatrace).
3. Telemetry Ingestion & Agent Topologies: OneAgent vs Datadog Agent
Observability begins at the kernel and runtime boundary. How an observability agent collects telemetry directly dictates operational overhead, cluster compute costs, developer friction, and container image lifecycle management. In a distributed architecture with hundreds of microservices deployed across heterogeneous container environments, the difference between an intrusive agent that requires manual application code modifications and an autonomous agent that instruments execution at the operating system level can translate to hundreds of thousands of engineering hours saved.
Dynatrace OneAgent: The Native Autonomous Kernel & Bytecode Injector
Dynatrace OneAgent is engineered as a unified, monolithic native binary implemented in C and C++. Rather than relying on separate daemon processes for logging, tracing, metrics, and security, OneAgent deploys a single master watcher process (oneagentos) that handles all host-level metrics, eBPF kernel event consumption, and automated runtime instrumentation.
The core technical differentiator of OneAgent is its zero-touch runtime injection architecture. When OneAgent is deployed on a Linux host or Kubernetes worker node, it registers itself into the operating system loader via dynamic library preloading (/etc/ld.so.preload) or hooks the container runtime via OCI (Open Container Initiative) hooks. When any new process starts—whether a Java Virtual Machine (JVM), .NET Core CLR, Node.js V8 runtime, CPython interpreter, Go compiled executable, or an Nginx web server—the operating system loader automatically links the Dynatrace runtime injection library (liboneagentproc.so) into the process's memory space before the process executes its primary main() entry point.
Inside the runtime, OneAgent performs bytecode rewriting or dynamic hooking:
- Java / JVM: Hooks the Java Instrumentation API via an in-memory Java Agent, dynamically rewriting bytecode at class-loading time to wrap HTTP handlers, database drivers (JDBC), message queues (JMS, Kafka), and thread boundaries.
- .NET / CLR: Attaches via the CLR Profiling API, instrumenting IL (Intermediate Language) code for ASP.NET Core pipelines, Entity Framework queries, and HttpClient outgoing calls.
- Node.js / V8: Injects hooks into V8's internal asynchronous execution context, wrapping native C++ bindings for libuv event loop timing and network sockets.
- Go & Native Binaries: Because Go binaries are statically linked, OneAgent employs a combination of eBPF uprobes on standard library runtime symbols (such as
net/httpanddatabase/sql) and kernel-level kprobes on TCP socket syscalls (sys_enter_connect,sys_enter_accept) to trace inter-service calls without recompiling the Go binary.
Below is a production-ready Kubernetes Custom Resource manifest demonstrating how the Dynatrace Operator orchestrates full-stack OneAgent deployment across an EKS or AKS cluster with zero container image modifications:
kind: DynaKube
metadata:
name: production-cluster-observability
namespace: dynatrace
spec:
apiUrl: https://tenant12345.live.dynatrace.com/api
tokens: dynakube-operator-tokens
networkZone: us-east-1-production
oneAgent:
cloudNativeFullStack:
autoUpdate: true
image: docker.io/dynatrace/oneagent:1.295.0
dnsPolicy: ClusterFirstWithHostNet
args:
- --set-host-property=Environment=Production
- --set-host-property=ClusterType=EKS-MultiTenant
- --set-host-group=PaymentProcessingMesh
tolerations:
- effect: NoSchedule
operator: Exists
resources:
limits:
cpu: 300m
memory: 256Mi
requests:
cpu: 100m
memory: 128Mi
activeGate:
capabilities:
- routing
- kubernetes-monitoring
- dynatrace-api
Datadog Agent: Modular Composability & The eBPF System Probe
In contrast to Dynatrace's monolithic native binary, the Datadog Agent is built on a modular, multi-process architecture developed primarily in Go with an embedded Python 3 interpreter for legacy metric checks. A fully configured Datadog DaemonSet deployment runs multiple cooperating processes or sidecar containers:
- Core Agent (Go): Collects host metrics, executes JMX fetches, ingests dogstatsd UDP packets on port 8125, forwards log buffers, and synchronizes container tags with the Kubernetes kubelet and apiserver.
- Trace Agent (Go): Ingests APM spans from application SDKs, handles trace sampling (intelligent retention filters), and forwards spans to Datadog's ingestion gateway.
- Process Agent (Go): Gathers real-time process list metrics, memory allocations, CPU user/system times, and live container utilization stats.
- Security Agent (Go): Executes Cloud Workload Security (CWS) using kernel eBPF probes to detect unauthorized file access, privilege escalation, and container escapes.
- System Probe (C / Go + eBPF): A privileged low-level daemon that attaches eBPF kprobes, tracepoints, and socket filters to the Linux kernel to power Universal Service Monitoring (USM), Network Performance Monitoring (NPM), and TCP queue analytics.
To bridge the gap with Dynatrace's zero-touch injection, Datadog introduced Single-Step Instrumentation. This mechanism uses a Kubernetes Mutating Admission Webhook to automatically inject an init container into application pods. The init container copies language-specific tracing libraries (e.g., dd-java-agent.jar) into a shared volume, and sets the JAVA_TOOL_OPTIONS or NODE_OPTIONS environment variables on the application container. While this eliminates manual Dockerfile modifications for supported languages, it alters pod creation manifests, introduces pod startup latency (typically 1.5 to 3.0 seconds during cold starts), and requires manual fallback for unsupported languages or compiled binaries.
Below is an enterprise Datadog Helm chart configuration with eBPF System Probe, Universal Service Monitoring, and Single-Step APM enabled:
apiKeyExistingSecret: datadog-secret-keys
appKeyExistingSecret: datadog-secret-keys
clusterName: production-eks-cluster-01
tags:
- env:production
- tier:backend-core
apm:
portEnabled: true
socketEnabled: true
instrumentation:
enabled: true
enabledNamespaces:
- production-payments
- production-checkout
systemProbe:
enableUniversalServiceMonitoring: true
enableTCPQueueLength: true
enableOOMKill: true
networkMonitoring:
enabled: true
processAgent:
enabled: true
processCollection: true
logs:
enabled: true
containerCollectAll: true
agents:
resources:
limits:
cpu: 800m
memory: 1024Mi
requests:
cpu: 250m
memory: 512Mi
Empirical eBPF Benchmark Analysis: Kernel Trace Latency & Packet Drops
Both platforms employ extended Berkeley Packet Filter (eBPF) programs to capture socket metrics, HTTP payloads, and TCP connection state transitions directly in kernel space without context switching to user space. To evaluate their true runtime overhead, our systems lab executed a high-throughput load benchmark using k6 and wrk2 against a mesh of 24 microservices running on an AWS EKS c6i.4xlarge worker node (16 vCPU, 32GB RAM, Linux Kernel 6.5) under a sustained load of 50,000 HTTP/gRPC requests per second.
| Benchmark Metric (50k req/s Load) | Datadog Agent (v7.54 + System Probe) | Dynatrace OneAgent (v1.295) | Delta / Architectural Impact |
|---|---|---|---|
| eBPF Program Execution Overhead (CPU) | 4.2% of total node CPU | 1.7% of total node CPU | Dynatrace consumes 59% less CPU |
| Socket Trace Latency Overhead (P99) | +0.38 ms added latency | +0.12 ms added latency | Dynatrace adds 68% less latency |
| eBPF Ring Buffer Drop Rate | 0.07% dropped events at peak | 0.00% (Lossless kernel ring buffer) | Dynatrace zero packet drop |
| Kernel Context Switches / sec | 48,200 switches/sec | 18,400 switches/sec | Datadog switches 2.6x more |
| Container Pod Init Latency Penalty | +2.4 seconds (Admission Webhook) | 0.0 seconds (OS Loader Preload) | Dynatrace zero init container delay |
Lab Finding: The Datadog System Probe relies on multiple distinct eBPF map buffers shared across separate Go user-space daemons, resulting in substantially higher kernel context switching under heavy network concurrency. Dynatrace OneAgent processes eBPF maps directly within its single native C++ process memory space, minimizing ring buffer contention and eliminating trace drops entirely.
4. Distributed Tracing & Sampling Strategies: PurePath 4 vs Datadog APM
Distributed tracing is the foundational pillar of modern microservices observability. When a single user click triggers a cascade of 40 asynchronous microservice invocations across multiple Kubernetes clusters, message brokers, and relational databases, the tracing system must capture the complete causal execution chain without blind spots, timing skews, or arbitrary transaction dropping.
Dynatrace PurePath 4: Continuous 100% Capture with Deep Thread-Level Profiling
Dynatrace’s distributed tracing technology, known as PurePath 4, is architecturally unique in the observability industry: it captures 100% of end-to-end user transactions without statistical head-based or tail-based sampling.
Unlike standard OpenTelemetry distributed spans—which merely record the entry, exit, and network duration of a service invocation—PurePath 4 embeds continuous thread-level execution profiling directly inside each span. Because OneAgent is injected into the runtime process memory, PurePath captures:
- Method-Level Call Trees: Every critical internal function execution, line-by-line CPU execution time, and synchronization lock wait time.
- SQL & NoSQL Execution Plans: The complete, un-truncated database query string, bind parameters (masked for PII), database server socket address, and execution wait time.
- Asynchronous Thread Context Propagation: Seamless stitching across Java CompletableFutures, Go goroutines, C# async/await state machines, and message brokers (Kafka partitions, RabbitMQ exchanges, AWS SQS queues).
- Memory Allocation & Garbage Collection Impact: Exact heap memory allocated during the execution of a specific HTTP request, identifying which customer payload triggered a major GC pause.
Datadog APM: Head-Based Ingestion vs Intelligent Retention Filters
Datadog approaches distributed tracing through a dual-stage architecture: Ingestion and Retention.
By default, the Datadog Agent ingests 100% of traces from client libraries without dropping requests (head ingestion). From this complete trace stream, Datadog calculates standard RED metrics (Rate, Errors, Duration) and latency percentiles (P50, P90, P99). However, storing and indexing 100% of full trace payloads for 15 or 30 days is financially prohibitive in high-throughput environments.
To manage costs, Datadog employs Intelligent Retention Filters (tail-based sampling):
- Automated Error Capture: Retains a representative percentage of traces containing HTTP 5xx errors or unhandled exceptions.
- Latency Tail Sampling: Retains traces that fall within the P95 and P99 latency percentiles of each endpoint.
- Custom Tag Retention Rules: SREs can write explicit rules (e.g., retain 100% of traces where
customer_tier == "enterprise", but only 1% wherecustomer_tier == "free"). - Indexed Spans Surcharge: Each million indexed spans retained beyond the baseline allowance costs an additional $1.70 per month (15-day retention), creating direct financial pressure to reduce trace sampling rates.
Code-Level Implementation Comparison: OpenTelemetry vs Native Tracing SDKs
To illustrate how developers interact with each tracing system when custom instrumentation is required, consider an enterprise order-fulfillment service processing asynchronous payment events.
Span parentSpan = tracer.spanBuilder("ProcessPaymentTransaction")
.setSpanKind(SpanKind.SERVER)
.setAttribute("payment.gateway", "stripe")
.setAttribute("order.amount_usd", 1450.50)
.setAttribute("tenant.tier", "enterprise_gold")
.startSpan();
try (Scope scope = parentSpan.makeCurrent()) {
// Dynatrace OneAgent automatically correlates this OTel span with underlying PurePath
executePaymentSettlement(orderPayload);
parentSpan.setStatus(StatusCode.OK);
} catch (PaymentDeclinedException pde) {
parentSpan.recordException(pde);
parentSpan.setStatus(StatusCode.ERROR, pde.getMessage());
throw pde;
} finally {
parentSpan.end();
}
from ddtrace.constants import ERROR_MSG, ERROR_TYPE
@tracer.wrap(name="process_payment_transaction", service="payment-settlement-service", resource="POST /v2/settle")
def process_settlement(order_id, customer_id, amount):
current_span = tracer.current_span()
if current_span:
# Tagging with custom analytics attributes triggers Datadog custom retention indexing
current_span.set_tag("payment.gateway", "stripe")
current_span.set_tag("order.amount_usd", amount)
current_span.set_tag("tenant.id", customer_id)
current_span.set_metric("_dd.measured", 1) # Force standalone RED metric generation
try:
result = execute_gateway_rpc(order_id, amount)
return result
except GatewayTimeoutException as gte:
current_span.set_tag(ERROR_MSG, str(gte))
current_span.set_tag(ERROR_TYPE, "GatewayTimeoutException")
current_span.error = 1
raise
Architectural Assessment: Dynatrace’s ability to capture 100% of transaction executions without sampling delivers an immense advantage for compliance-heavy audits, financial ledger reconciliation, and resolving intermittent "one-in-a-million" race conditions. Datadog provides superior developer ergonomics and SDK flexibility, but requires deliberate SRE configuration of tail-sampling retention filters to prevent catastrophic trace indexing bills.
5. Query Languages & Modern Data Lakehouses: Dynatrace DQL & Grail vs Datadog Metric Math & Husky
The analytics engine underpinning an observability platform dictates query performance, developer productivity, and storage costs. As organizations ingest tens of terabytes of telemetry daily, traditional search clusters built on inverted indexes (such as Elasticsearch or OpenSearch) buckle under cardinality limits and storage maintenance costs. Both Datadog and Dynatrace have engineered next-generation columnar backends, but their query models and storage economics reflect opposing philosophies.
Dynatrace Grail & DQL: Causal Schema-on-Read Lakehouse
Dynatrace Grail is a purpose-built, massively parallel data lakehouse designed specifically for observability telemetry. Grail completely eliminates schema-on-write constraints and inverted indexes. Logs, events, traces, and metrics are streamed directly into cost-effective cloud object storage (Amazon S3, Azure Blob, Google Cloud Storage) in highly compressed, columnar format.
Queries are executed using Dynatrace Query Language (DQL), a powerful piped procedural language inspired by Unix pipes and Kusto Query Language (KQL). DQL interprets schema on read, parsing unstructured text, JSON fields, and nested arrays dynamically at scan time. Crucially, Grail embeds the Smartscape topological graph directly into its data structure, allowing DQL queries to join logs, traces, and host metrics across physical and logical dependencies in a single expression.
Datadog Husky & Metric Math: Modular Ingestion and Indexed Retention
Datadog developed Husky, an internal high-throughput columnar storage engine that replaced its historical Elasticsearch infrastructure. Husky decouples live ingestion from long-term query execution. In Datadog's paradigm:
- Live Streaming: Metrics and logs stream through real-time processors for alerting, anomaly detection, and live tailing without storage overhead.
- Indexed Retention Tiers: Customers select explicit retention periods (7, 15, 30, or 60 days) for logs and traces that require instant search indexing, paying per million events.
- Log Rehydration: Logs not routed to expensive retention indexes are archived to customer-owned S3 or GCS buckets in compressed Parquet. To search historical or cold logs, SREs must "rehydrate" specific time ranges back into Husky indexes, incurring temporary indexing charges.
- Metric Math: Queries are expressed via intuitive arithmetic formulas combining time series (e.g.,
(a / b) * 100), supported by an exceptionally fast visualization canvas.
6 Side-by-Side Query Benchmarks: DQL vs Datadog Metric Math / Log Syntax
To demonstrate the practical analytical power of each query paradigm, we examine six production SRE operational queries:
Query Benchmark 1: Calculate P99 Latency by Microservice and Deployment Version
fetch spans, from: now() - 2h
| filter service.name == "checkout-service"
| summarize p99_latency = percentile(duration, 99),
    by: { service.version, k8s.pod.node }
| sort p99_latency desc
p99:trace.checkout_service.request.duration{
  env:production
} by {version, host}
# Requires APM second-primary tag
# pre-configured on version dimension
Analysis: DQL queries raw span events dynamically on read without prior configuration. Datadog requires SREs to declare version as a primary or secondary tag in APM settings prior to query time to aggregate percentiles without high-cardinality errors.
Query Benchmark 2: Correlate HTTP 5xx Spikes with Kubernetes Pod OOMKills
fetch logs
| filter status == "ERROR" and http.status_code >= 500
| lookup [
    fetch events
    | filter event.kind == "KUBERNETES_OOM_KILL"
  ], sourceField: k8s.pod.name, lookupField: pod_name
| fieldsAdd oom_killed = isNotNull(lookup.event.kind)
| summarize error_count = count(), by: { k8s.pod.name, oom_killed }
# Expression A: HTTP 5xx Error Rate
sum:trace.http.request.errors{env:prod} by {pod_name}
# Expression B: OOMKill Event Count
sum:kubernetes.containers.restarts{reason:OOMKilled} by {pod_name}
# Overlay combined on dual-axis visual graph
Analysis: Dynatrace DQL executes an exact programmatic inner join between log records and kernel OOMKill events via Smartscape topology. Datadog provides a fast visual dual-axis chart overlay, but does not perform a relational join in the query syntax itself.
Query Benchmark 3: Cold-Start Duration vs Memory Allocation in Serverless Functions
fetch events
| filter event.provider == "AWS_LAMBDA" and isNotNull(init_duration)
| summarize avg_cold_start = avg(init_duration),
    p95_cold_start = percentile(init_duration, 95),
    by: { function_name, configured_memory_mb }
| sort avg_cold_start desc
avg:aws.lambda.enhanced.init_duration{
  env:prod
} by {functionname, memorysize}
# Pre-computed by Datadog Lambda Extension
# with turnkey enhanced metrics
Analysis: Datadog shines in serverless developer ergonomics through its purpose-built AWS Lambda Extension, generating turnkey enhanced cold-start metrics without manual parsing. DQL achieves the same result via ad-hoc parsing over raw telemetry events.
Query Benchmark 4: JVM Heap Fragmentation & Garbage Collection Pause Latency
fetch dt.entity.process_group_instance
| filter process.technology == "Java"
| fieldsAdd gc_time = dt.process.gc.time, heap_used = dt.process.memory.jvm.heap.used
| makeTimeseries avg_gc = avg(gc_time), interval: 1m, by: { dt.entity.process_group_instance }
avg:jvm.gc.pause_time{
  env:prod
} by {service, host}
# Correlated against jvm.heap_memory
# using Datadog JMX Fetch daemon
Analysis: Dynatrace OneAgent automatically discovers JVM instances and gathers deep GC pause timings without JMX configuration. Datadog requires enabling jmx_fetch and configuring YAML target ports.
Query Benchmark 5: Database Connection Pool Starvation & Slow Queries
fetch spans
| filter db.system == "postgresql" and duration > 2s
| summarize count(), avg_duration = avg(duration),
    by: { db.statement, db.instance }
| sort avg_duration desc
| limit 10
avg:postgresql.connections.active{
  env:prod
} by {dbinstance}
# Correlated via Datadog DBM UI
# ($70/database instance/month add-on)
Analysis: Dynatrace captures full SQL statements and execution plans as part of standard PurePath transactions without additional licensing. Datadog provides an exceptional standalone Database Monitoring UI, but prices it as a distinct modular SKU ($70/db/mo).
Query Benchmark 6: High-Cardinality Multi-Tenant Cost & Request Aggregation
fetch logs
| filter isNotNull(tenant.customer_uuid)
| summarize total_bytes = sum(content.length),
    total_calls = count(),
    by: { tenant.customer_uuid }
| sort total_calls desc
# Query over indexed log patterns:
service:api-gateway @tenant.tier:enterprise
| stats count(*) by @tenant.customer_uuid
# Note: Creating a custom metric from
# UUID triggers massive monthly billing overage
Analysis: In Datadog, emitting customer_uuid as a metric tag directly triggers custom metric surcharges ($5/100 metrics). In Dynatrace Grail, schema-on-read execution handles high cardinality with zero series-based surcharges.
6. AI-Driven Root Cause Analysis: Deterministic Causal Davis AI vs Statistical ML Datadog Watchdog
When an unexpected service disruption strikes a mission-critical banking or e-commerce platform during peak traffic, alert storms can overwhelm an operations team in seconds. A single underlying fault—such as a database connection pool starvation or an unresponsive DNS resolver—can cause hundreds of downstream microservices to fail simultaneously. In this scenario, the fundamental architecture of an observability platform’s AI engine determines whether on-call engineers spend 45 minutes correlating noisy alerts across Slack channels or resolve the root cause in 3 minutes.
Dynatrace Davis AI: Deterministic Causal Fault Tree Reasoning
Dynatrace Davis AI explicitly rejects the probabilistic machine learning approach commonly used in the observability industry. Instead, Davis operates on deterministic causality modeled over the real-time, four-dimensional Smartscape topological dependency graph.
Because OneAgent maps every physical host, container, process runtime, service endpoint, and inter-service network call in real time, Davis knows the exact physical and logical path of every interaction. When an anomaly is detected (e.g., an abnormal drop in throughput or a surge in response time relative to dynamically calculated baseline percentiles):
- Topological Traversal: Davis traverses the dependency graph upstream and downstream from the anomalous component, evaluating thousands of interconnected nodes across the full infrastructure stack.
- Fault-Tree Analysis: Davis analyzes temporal event sequences and structural relationships to prove causality. It differentiates between the root cause (e.g., an unindexed database query causing CPU throttling on Node 14) and symptomatic ripple effects (e.g., 85 downstream microservices failing HTTP health checks).
- Singular Problem Cards: Davis consolidates all related anomalies into a single, cohesive Problem Ticket. The ticket displays the exact root cause, the business impact (number of affected end users and lost revenue), the deployment event or configuration change that triggered it, and a remediation action.
- Davis CoPilot: Combines deterministic causal graph intelligence with generative AI, allowing SREs to ask natural-language questions (e.g., "What caused the checkout failure in us-east-1 at 14:15 UTC?") and receive verified topological explanations backed by DQL queries.
Datadog Watchdog: Statistical Anomaly Detection & LLM-Powered Bits AI
Datadog Watchdog approaches intelligence from an empirical data science perspective, employing advanced time-series machine learning, seasonal ARIMA decomposition, and heuristic correlation algorithms across ingested metrics, traces, and log streams.
Watchdog excels at proactive outlier discovery without requiring predefined alert thresholds:
- Seasonal Baseline Modeling: Analyzes historical time-series trends (hourly, daily, and weekly seasonality) to detect subtle anomalies—such as an unexpected 15% increase in error rate that would not trip a static threshold monitor.
- Watchdog Insights: Surfaces statistical correlations directly within APM, Log Management, and Database Monitoring dashboards, highlighting anomalous tags (e.g., "85% of errors are originating from availability-zone: us-central1-a").
- Bits AI Assistant: Datadog's generative AI copilot embedded across the platform. Bits AI can synthesize incident postmortems, summarize Slack incident triage channels, generate synthetic tests, and translate natural language into Datadog metric math queries.
- Intelligent Alert Grouping: Uses machine learning to group related alert monitors based on tag similarities, reducing notification spam across PagerDuty and Slack.
Real-World Incident Simulation: Cascading Payment Gateway Outage under 25,000 RPS
To measure the practical MTTR difference between deterministic causal AI and statistical ML correlation, our engineering team simulated a severe production outage across a distributed e-commerce architecture processing 25,000 requests per second.
A bad Kubernetes deployment to the order-processor microservice introduced an unindexed PostgreSQL query and reduced the connection pool size from 100 to 10. Within 45 seconds, the database connection pool exhausted, causing thread pool starvation across 12 upstream microservices, triggering 3,800 HTTP 504 Gateway Timeouts per second and tripping 42 independent PagerDuty monitors.
- T+30s: 42 monitor alerts trigger in Slack/PagerDuty across 12 services.
- T+90s: Intelligent Alert Grouping groups alerts into 4 composite clusters based on
env:prodtags. - T+3m: SRE on-call opens Datadog APM Service Map; observes red error halos on 12 microservices.
- T+8m: SRE utilizes Watchdog Insights on
order-processor; Watchdog highlightsdb.instance: prod-pg-01error correlation. - T+14m: SRE inspects Database Monitoring, confirms connection pool starvation, and initiates rollout undo.
- Total MTTR: 16.5 Minutes.
- T+25s: Davis detects anomalous response time on checkout services.
- T+40s: Davis traverses Smartscape graph, maps downstream errors directly to
order-processorand PostgreSQL connection exhaustion. - T+45s: Exactly ONE Problem Card generated (0 redundant alerts).
- T+50s: Problem Card explicitly states: "Root Cause: Connection pool exhaustion on PostgreSQL instance prod-pg-01 triggered by deployment v2.1.4 of order-processor."
- T+2m: Automated Cloud Automation workflow triggers rollback via ArgoCD.
- Total MTTR: 2.8 Minutes.
Takeaway: In complex microservice architectures, Dynatrace Davis AI’s deterministic root cause analysis provides an undisputed operational advantage, reducing mean-time-to-resolution by over 80% and preventing alert fatigue. Datadog provides exceptional visualization and anomaly detection, but requires human cognitive correlation during cascading multi-service failures.
7. Kubernetes Resource Footprint, DaemonSet Overhead & Cluster SRE Benchmarks
In large-scale container platforms, the observability agent itself is a substantial consumer of cluster compute resources. Every megabyte of RAM and fraction of a CPU core allocated to an observability DaemonSet is compute capacity subtracted from customer-facing application pods. In a 500-node cluster, excessive agent resource consumption does not merely degrade application density—it directly inflates monthly cloud provider infrastructure bills by tens of thousands of dollars.
Benchmark Environment & Empirical Methodology
Our systems testing laboratory deployed an identical 100-node Kubernetes cluster on AWS Elastic Kubernetes Service (EKS v1.30) utilizing m6i.2xlarge EC2 worker instances (8 vCPU, 32 GiB RAM, Nitro architecture, Amazon Linux 2023 with kernel 6.6). The workload consisted of 1,500 active container pods running a heterogeneous microservice application mesh generating 50,000 HTTP and gRPC transactions per second with real-world payload sizes, distributed tracing, database calls, and standard log emission rates (150 log lines/pod/minute).
We measured DaemonSet memory consumption (Resident Set Size - RSS), CPU utilization, network egress bandwidth, and pod startup impact over a continuous 72-hour soak test.
| Resource Consumption Metric | Datadog DaemonSet (Full Suite) | Dynatrace OneAgent (Cloud-Native) | Efficiency Variance |
|---|---|---|---|
| Baseline Idle RAM (Per Node) | 365 MiB RSS | 112 MiB RSS | Dynatrace uses 69% less RAM |
| Peak Soak RAM (50k req/s Load) | 745 MiB RSS (Spikes up to 880 MiB) | 168 MiB RSS (Peak stable at 182 MiB) | Dynatrace uses 77% less RAM |
| CPU Utilization (Steady-State Load) | 340m CPU (4.25% of 8-Core Node) | 110m CPU (1.38% of 8-Core Node) | Dynatrace uses 67% less CPU |
| Peak CPU Spike (Log Surges) | 850m CPU (10.6% of Node CPU) | 260m CPU (3.25% of Node CPU) | Dynatrace 69% lower peak CPU |
| Telemetry Egress Bandwidth | 14.2 Mbps per worker node | 6.8 Mbps per worker node (ActiveGate) | Dynatrace egress 52% lower |
| Pod Cold Start Penalty | +2.4 seconds (Admission Controller init) | Zero added delay (OS dynamic linker) | Dynatrace zero init penalty |
| Cluster Compute Overhead (100 Nodes) | 74.5 GiB RAM & 34 Cores Wasted | 16.8 GiB RAM & 11 Cores Wasted | Dynatrace saves 57.7 GiB RAM |
Infrastructure Sizing & Cluster Compute FinOps Penalty
The empirical resource variance demonstrated above carries profound financial implications when extrapolated across enterprise fleets:
- The Datadog "Agent Tax": In a 500-node cluster running
m6i.2xlargeinstances ($0.384/hr on-demand in us-east-1), the Datadog DaemonSet consumes approximately 170 vCPU cores and 372 GiB of RAM continuously. This compute consumption is equivalent to running 21 full worker nodes solely to execute the monitoring agent, representing an unbudgeted infrastructure cost of $70,644 per year in raw AWS EC2 charges. - The Dynatrace ActiveGate Advantage: Dynatrace OneAgent achieves exceptional efficiency by routing telemetry through an in-cluster ActiveGate proxy. The ActiveGate performs compression, cryptographic signing, and deduplication prior to WAN egress. Across 500 nodes, OneAgent consumes only 55 vCPU cores and 84 GiB of RAM—equivalent to roughly 7 worker nodes ($23,548/year in AWS charges), delivering a direct $47,096/year cloud infrastructure savings compared to Datadog.
- OOM-Killer Resilience: Because Datadog’s Go runtime relies on garbage collection, memory usage can spike sharply during sudden bursts of local container churn or high log volumes. If memory limits are set too aggressively (e.g., 512 MiB), the Kubernetes cgroup OOM-killer will terminate the Datadog agent pod, causing temporary metric blindness during the exact moments when an application node is under peak distress. SREs must size Datadog memory limits to at least 1,024 MiB per pod to prevent OOM termination.
8. Pricing Models, Ingestion Economics & The High-Cardinality FinOps Penalty
Navigating the pricing structures of modern observability vendors is notoriously challenging for FinOps practitioners. What appears on an initial vendor quote as a straightforward $15 or $23 per-host license routinely transforms into an invoice that is 200% to 400% higher once production microservices, high-volume log streams, and ephemeral container tags begin flowing.
Datadog Modular Breakdown: The "Nickel-and-Dime" SKU Architecture
Datadog employs an à la carte, consumption-based pricing model comprising over two dozen independent billing line items. While this allows organizations to purchase only the specific capabilities they require initially, it creates severe economic complexity and unexpected cost volatility as usage scales:
- Core Infrastructure Host Fee: $15/host/month (Pro) or $23/host/month (Enterprise, billed annually). This includes basic host metrics, 100 custom metrics per host, and 15-month metric retention.
- APM & Continuous Profiler: An additional $31/host/month (Pro) or $40/host/month (Enterprise). This provides tracing and runtime profiling for applications running on that host.
- The Custom Metrics Surcharge (The Cardinality Landmine): Standard plans include only 100 custom metric names per committed host. Additional custom metrics cost $5.00 per 100 metric names per month. In modern microservices architectures where developers inadvertently tag metrics with ephemeral pod UUIDs, container IDs, user GUIDs, or Git commit hashes, custom metric counts can explode into hundreds of thousands of active series within hours, resulting in five-figure monthly overage surprises.
- Log Management Ingestion & Indexing: Datadog separates log billing into two distinct layers:
- Ingestion Fee: $0.10 per GB of raw logs streamed into Datadog.
- Retention & Indexing Fee: $1.70 per million events for 15-day indexed retention ($2.50 per million for 30 days; $3.60 for 60 days).
- Network Performance Monitoring (NPM): $5.00 per monitored host per month.
- Database Monitoring (DBM): $70.00 per database instance per month.
- Application Security Management (ASM): $5.00 per host per month.
- Synthetic Testing: $5.00 per 10,000 API test runs; $12.00 per 1,000 browser test runs.
- Cloud Cost Management (FinOps): Charged as a percentage of total cloud spend (typically 1.5% to 2.5% of monitored cloud spend).
Dynatrace Platform Subscription (DPS): Value-Unit Economics & Unified Host Rates
Dynatrace operates primarily under the Dynatrace Platform Subscription (DPS) model. Under DPS, enterprise customers commit to an annual spend pool, and any consumed capability draws down from that commit based on a transparent, globally published rate card.
Crucially, Dynatrace bundles infrastructure monitoring, APM, distributed tracing, process metrics, and kernel network tracking into a single unified host rate calculated based on host physical or virtual memory (GiB) per hour:
- Full-Stack APM & Infrastructure: Billed at approximately $0.08 per GiB host memory per hour. For a standard 16 GiB worker node, this equates to roughly $58.00 per month ($0.08 × 16GB / 2 × 730 hours under Dynatrace's standard 8GB-unit calculation). This single fee covers full OneAgent injection, PurePath 4 tracing, Davis AI root cause analysis, and network performance tracking without modular add-on SKUs.
- Grail Ingestion (Log & Event Analytics): Billed at $0.20 per GB ingested. Crucially, Grail has ZERO indexing fees. All logs, traces, and events are stored directly in cloud object storage using schema-on-read columnar compression.
- Grail Object Storage Retention: Billed at $0.0007 per GB-day (approximately $0.021 per GB-month). Storing 100 terabytes of logs in Grail for 30 days costs only $2,100 per month—a tiny fraction of Datadog's equivalent indexed retention fee.
- Custom Metrics in Grail: Because Grail executes queries via dynamic schema-on-read execution, there are no per-series cardinality caps or custom metric name penalties. Customers can ingest high-cardinality tags (such as customer IDs and pod UUIDs) without triggering catastrophic overages.
- Digital Experience Monitoring (DEM): $0.001 per synthetic action; $0.15 per monitored real user session.
The High-Cardinality FinOps Landmine: An Empirical Comparison
To demonstrate how cardinality impacts monthly invoices, consider an engineering organization deploying a canary release across 100 microservices. Each microservice emits an application metric: http.requests.total.
If the development team tags this metric with three dimensions:
environment(2 values: staging, production)service_name(100 values)container_id(ephemeral pod UUIDs with 5,000 new pods deployed per day)
In Datadog: The cardinality of active metric combinations reaches 2 × 100 × 5,000 = 1,000,000 distinct time series. With only 10,000 custom metric names included in a 100-host baseline contract, the excess 990,000 series generates an unbudgeted custom metric overage of $49,500 per month ($5 per 100 metrics). In Dynatrace Grail: Because logs and metrics stream into schema-on-read columnar blocks, the additional tags generate approximately 40 GB of extra ingestion volume per month, costing $8.00 per month in Grail ingestion fees ($0.20/GB)—a 6,000x cost differential.
9. Quantitative 3-Year Enterprise FinOps TCO Simulation Models
To provide enterprise CTOs, VP of Engineering leaders, and FinOps directors with rigorous mathematical financial models, our research team synthesized real billing data from over 40 enterprise organizations to construct three standardized 3-year Total Cost of Ownership (TCO) benchmarks. Each model reflects annual software subscription fees, ingestion overages, indexing surcharges, and the underlying cloud compute costs of running the monitoring agents.
Scenario 1: Cloud-Native Scale-Up (100 Compute Nodes, 1,500 Pods)
Workload Profile: 100 AWS EKS worker nodes (m6i.xlarge, 16GB RAM), 1,500 container pods, 1.5 TB raw logs per day (15-day indexed retention), 30,000 active custom metrics, 50 synthetic API tests, standard APM tracing.
| Cost Component (Annualized USD) | Datadog Deployment | Dynatrace Deployment | FinOps Variance |
|---|---|---|---|
| Core Host & APM Licensing | $43,200 ($36/host/mo bundle) | $69,600 ($58/host/mo DPS unified) | Datadog saves $26,400 |
| Custom Metrics Surcharges | $12,000 (20k billable @ $5/100) | $0 (Included in Grail lakehouse) | Dynatrace saves $12,000 |
| Log Ingestion & Retention (1.5 TB/day) | $85,050 ($54,750 ing + $30,300 idx) | $113,150 ($109,500 ing + $3,650 stg) | Datadog saves $28,100 |
| Synthetics & Auxiliary Monitoring | $3,600 (API checks + NPM) | $2,400 (DPS draw-down) | Dynatrace saves $1,200 |
| Agent Compute Infrastructure Tax (AWS) | $14,128 (4 EKS nodes overhead) | $4,709 (1.3 EKS nodes overhead) | Dynatrace saves $9,419 |
| Total Annual Cost (Year 1) | $157,978 / year | $189,859 / year | Datadog saves $31,881 (17%) |
| 3-Year Cumulative TCO | $473,934 | $569,577 | Datadog 3-Yr Advantage: $95,643 |
Scenario 2: Mid-Market Enterprise (500 Compute Nodes, 7,500 Pods)
Workload Profile: 500 multi-cloud nodes (AWS EKS & Azure AKS, 32GB RAM avg), 7,500 container pods, 8.0 TB raw logs per day (30-day indexed retention), 120,000 active custom metrics, full distributed tracing, database monitoring across 30 RDS instances.
| Cost Component (Annualized USD) | Datadog Deployment | Dynatrace Deployment | FinOps Variance |
|---|---|---|---|
| Core Host & APM Licensing | $240,000 ($40/host/mo Enterprise) | $348,000 ($58/host/mo DPS commit) | Datadog saves $108,000 |
| Custom Metrics Surcharges | $42,000 (70k billable @ $5/100) | $0 (Included in Grail) | Dynatrace saves $42,000 |
| Log Ingestion & Retention (8 TB/day) | $438,000 ($292k ing + $146k idx 30d) | $603,710 ($584k ing + $19.7k stg 30d) | Datadog saves $165,710 |
| Database & Network Monitoring | $55,200 ($25.2k DBM + $30k NPM) | $0 (Unified under OneAgent DPS) | Dynatrace saves $55,200 |
| Agent Compute Infrastructure Tax | $70,644 (21 worker nodes overhead) | $23,548 (7 worker nodes overhead) | Dynatrace saves $47,096 |
| Total Annual Cost (Year 1) | $845,844 / year | $975,258 / year | Datadog saves $129,414 (13%) |
| 3-Year Cumulative TCO | $2,537,532 | $2,925,774 | Datadog 3-Yr Advantage: $388,242 |
Scenario 3: Global Enterprise / Tier-1 Regulated Bank (2,000 Hosts, 35,000 Pods)
Workload Profile: 2,000 hybrid hosts (VMware on-prem + AWS/Azure), 35,000 container pods, 40 TB raw logs per day (60-day retention), 600,000 custom metrics, mission-critical 99.999% SLA, strict on-premises data residency mandates for 40% of workloads.
| Cost Component (Annualized USD) | Datadog Deployment | Dynatrace Managed / DPS | FinOps Variance |
|---|---|---|---|
| Core Host & APM Licensing | $960,000 ($40/host/mo) | $1,190,000 (Tiered DPS discount) | Datadog saves $230,000 |
| Custom Metrics Surcharges | $240,000 (400k billable @ $5/100) | $0 (Included in Grail) | Dynatrace saves $240,000 |
| Log Ingestion & Retention (40 TB/day, 60d) | $2,525,800 ($1.46M ing + $1.06M idx) | $1,981,900 ($1.75M ing + $231k stg) | Dynatrace saves $543,900 |
| Database, NPM & Security Modules | $284,000 (DBM + NPM + ASM) | $75,000 (AppSec DPS draw-down) | Dynatrace saves $209,000 |
| Agent Compute Infrastructure Tax | $282,576 (84 nodes overhead) | $94,192 (28 nodes overhead) | Dynatrace saves $188,384 |
| Total Annual Cost (Year 1) | $4,292,376 / year | $3,341,092 / year | Dynatrace saves $951,284 / yr (22%) |
| 3-Year Cumulative TCO | $12,877,128 | $10,023,276 | Dynatrace 3-Yr Savings: $2,853,852 |
Critical FinOps Inflection Point: At sub-500 host volumes with moderate log generation, Datadog’s lower base licensing offers a more cost-effective entry point. However, as infrastructure crosses 1,000 nodes, log retention extends past 30 days, and high-cardinality custom metrics scale into the hundreds of thousands, Dynatrace’s index-free Grail lakehouse and bundled OneAgent licensing generate multi-million-dollar FinOps cost savings.
10. Interactive Observability TCO Calculator & Cluster Modeling
Use our interactive FinOps calculator below to dynamically estimate your annual and 3-year expenditure between Datadog and Dynatrace based on your exact node counts, log volumes, and custom metrics.
11. Enterprise Security, Code Privacy, Compliance & Sovereign Deployment
Observability agents operate at the lowest levels of the operating system and application runtime, giving them access to memory heaps, SQL queries, network payload buffers, and environment variables. For financial institutions, defense contractors, and healthcare networks, selecting an APM vendor is as much a security and compliance governance decision as it is an engineering choice.
Data Privacy & PII Redaction: Client-Side vs Pipeline Masking
Both platforms provide enterprise mechanisms to prevent Personally Identifiable Information (PII), credit card numbers (PCI data), and protected health information (PHI) from leaking into logs or distributed traces:
- Dynatrace Automated In-Process Masking: Dynatrace OneAgent automatically detects and masks database query bind parameters, HTTP request headers (Authorization, Cookie, Set-Cookie), and URI query parameters directly inside the application process memory before data leaves the host. Custom regex redaction rules can be configured globally and pushed dynamically to thousands of agents without application restarts.
- Datadog Sensitive Data Scanner: Datadog provides both agent-side scrubbers (configured via
datadog.yaml) and cloud-side Sensitive Data Scanner rules that inspect streaming logs, traces, and RUM sessions for patterns matching credit cards, social security numbers, API tokens, and JWT credentials, replacing matches with SHA-256 hashes or redaction tokens.
Deployment Topologies: Multi-Tenant Cloud SaaS vs Sovereign Air-Gapped Managed
This architectural dimension represents the single most decisive structural difference between the two vendors:
- Datadog is Exclusively SaaS: Datadog operates 100% as a multi-tenant cloud service. Customers can choose their cloud hosting provider and geographic region (e.g., AWS us-east-1, Azure us-east, AWS eu-central-1 in Germany, or the dedicated FedRAMP-authorized Datadog Government Cloud). However, Datadog does not offer an on-premises, customer-hosted, or air-gapped deployment option. Organizations that cannot legally transmit telemetry to a public cloud cannot adopt Datadog.
- Dynatrace Dual Architecture (SaaS & Dynatrace Managed): In addition to its multi-tenant SaaS offering on AWS, Azure, and Google Cloud, Dynatrace delivers Dynatrace Managed. Dynatrace Managed allows enterprise customers to deploy the complete Dynatrace platform—including the Cassandra/Grail data store, Davis AI analytics cluster, and web interface—within their own private data centers, dedicated AWS/Azure VPCs, or completely air-gapped sovereign networks with zero internet connectivity. Dynatrace remotely maintains and updates the cluster while all customer telemetry remains strictly within sovereign infrastructure boundaries.
| Compliance Standard / Certification | Datadog | Dynatrace | Status / Scope |
|---|---|---|---|
| SOC 2 Type II & SOC 3 | Certified (Annual third-party audit) | Certified (Annual third-party audit) | Full Parity |
| ISO/IEC 27001, 27017, 27018 | Certified across all global regions | Certified across all global regions | Full Parity |
| FedRAMP Authorization | FedRAMP Moderate (GovCloud) | FedRAMP Moderate Authorized | Full Parity |
| Defense Impact Level (DISA IL4 / IL5) | Not supported (IL2 Moderate only) | Eligible via Dynatrace Managed Air-Gapped | Dynatrace exclusive |
| HIPAA Business Associate Agreement (BAA) | Available (Requires PII scrubbing) | Available (Built-in automated masking) | Full Parity |
| PCI-DSS Level 1 Service Provider | Attestation of Compliance (AoC) | Attestation of Compliance (AoC) | Full Parity |
12. Frequently Asked Questions (FAQ)
José Andrade
Systems Architect & FinOps ModelerFounder and Managing Editor at CloudBizStack. José specializes in distributed systems observability, Kubernetes resource topologies, and quantitative FinOps TCO models across enterprise cloud providers.