Honeycomb vs Datadog: Observability & APM Benchmark (2026)
1. Executive Summary & Architectural Verdict (TL;DR)
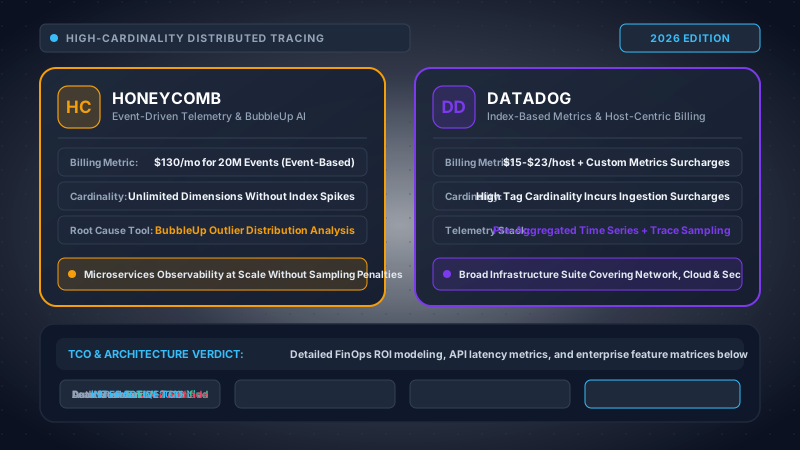
In the modern cloud infrastructure ecosystem of 2026, the technical debate between Honeycomb and Datadog is not merely a tool selection exercise. It represents a fundamental schism between two irreconcilable engineering philosophies: high-cardinality exploratory event telemetry versus pre-aggregated metric monitoring unified across a broad operational suite.
For over a decade, enterprise monitoring relied upon the classic "three pillars of observability": metrics for detection, logs for context, and distributed traces for latency path isolation. Datadog perfected this paradigm, building an expansive, multi-billion-dollar enterprise platform with more than 750 pre-built integrations, turnkey host agents, synthetic user testing, network packet inspection (eBPF NPM), database monitoring, and native Cloud SIEM. However, this three-pillar architecture forces engineering teams to maintain separate data pipelines, correlate disparate IDs across isolated silos, and strictly constrain tag cardinality to avoid ruinous monthly custom metric surcharges.
Conversely, Honeycomb discarded the three-pillar dogma entirely. Pioneered by distributed systems veterans Charity Majors and Christine Yen, Honeycomb is architected around a single primitive: the wide structured event. By persisting every trace span as an arbitrarily wide JSON-like record containing hundreds of contextual dimensions—stored in a proprietary, unindexed columnar storage engine called Retriever—Honeycomb allows software engineers to interrogate novel production failure modes ("unknown unknowns") in sub-second queries without downsampling, schema management, or cardinality penalties.
Executive Verdict Framework: Where Each Platform Wins
| Organizational Profile & Core Use Case | Honeycomb | Datadog | Architectural Verdict |
|---|---|---|---|
| Cloud-Native Microservices & High-Velocity SRE | Native wide events, sub-second BubbleUp anomaly isolation, zero cardinality fees | Pre-aggregated metrics, Watchdog anomaly detection, siloed traces | Honeycomb (Superior Root Cause MTTR) |
| Enterprise IT Ops, Hybrid Cloud & Infrastructure Consolidation | Requires OpenTelemetry collector for host telemetry; no proprietary physical network suite | 750+ turnkey integrations, automated eBPF host discovery, SNMP, VMware, bare-metal | Datadog (Complete Infrastructure Suite) |
| High-Cardinality Debugging (Per-Tenant, Per-User, Per-Cart) | Unlimited dimensions (UUIDs, customer IDs, container hashes) with zero index cost | Severe custom metric overages ($5.00/100 metrics/mo) when dimension exceeds host allotment | Honeycomb (Decisive Winner) |
| FinOps Budget Predictability & Cost Control | Event-based billing; unlimited query seats, predictable data volume via Refinery tail sampling | 20+ metered SKUs (hosts, custom metrics, log retention, synthetic runs, APM spans) | Honeycomb (Zero Bill-Shock Risk) |
| Unified SecOps, SIEM & Synthetic User Monitoring | No native SIEM, compliance log archive, or headless browser synthetic testing engine | Turnkey Cloud SIEM, CSM, Sensitive Data Scanner, Global Synthetic Test Run mesh | Datadog (Enterprise Security Breadth) |
| Zero-Data-Retention & Regulated Data Sovereignty | Secure Tenancy KMS proxy: data encrypted before leaving customer VPC, keys never shared | Sensitive Data Scanner regex scrubbing; data processed in Datadog cloud zones | Honeycomb (Secure Tenancy Cryptography) |
Architect's Recommendation: Choose Honeycomb if your engineering organization is building modern, distributed microservices on Kubernetes, serverless, or event-driven backends, where MTTR is dominated by transient, high-cardinality anomalies across customer IDs, feature flags, or microservice versions. Choose Datadog if your primary objective is enterprise IT consolidation—unifying physical network monitoring, VMware hosts, security compliance (SIEM), synthetic endpoint testing, and executive NOC dashboards under a single procurement contract.
2. Core Telemetry Engine: Wide Structured Events vs 3-Pillar Aggregations
To understand the operational divergent between Honeycomb and Datadog, one must examine the low-level data storage mechanics and mathematical properties of cardinality that govern both platforms.
The Cardinality Mathematics: Combinatorial Explosion
In traditional time series databases (TSDBs) such as Datadog's Husky or open-source Prometheus, a metric is defined by its name and a set of key-value pairs (tags). The TSDB creates an independent time series for every unique permutation of tag values. Mathematically, if an application emits a metric with $k$ dimensions, the total number of distinct time series $S$ generated is given by the Cartesian product of the distinct value cardinalities:
Consider an e-commerce microservice tracking HTTP request duration:
region: 5 values (us-east-1,us-west-2,eu-west-1,ap-southeast-1,sa-east-1)http_status: 15 values (200, 201, 400, 401, 403, 404, 500, 502, etc.)endpoint: 80 API routescontainer_id: 250 active Kubernetes pods
Under this configuration, the TSDB manages:
5 × 15 × 80 × 250 = 1,500,000 distinct time series.
Now, suppose a software engineer attempts to inject real-time debugging context by appending user_id (5,000,000 active users) and order_id (20,000,000 orders per day). The resulting cardinality becomes:
1,500,000 × 5,000,000 × 20,000,000 = 1.5 × 10²⁰ time series.
In Datadog, this combinatorial explosion immediately causes the ingestion pipeline to drop metrics, crash dashboard queries, or generate custom metric overage bills running into millions of dollars. As a defensive workaround, engineers are instructed to strip high-cardinality identifiers from metrics and isolate them in log lines or distributed traces.
Honeycomb Retriever: The Columnar Event Engine
Honeycomb fundamentally circumvents this mathematical bottleneck through its columnar engine, Retriever. Retriever is an unindexed, append-only, distributed columnar database explicitly designed for wide structured events. In Honeycomb:
- No Pre-Aggregation: Telemetry is never summarized into 10-second or 1-minute buckets at ingestion time. Every raw event is preserved with full fidelity.
- No Inverted Indices: Retriever does not construct traditional Lucene-style B-trees or inverted indices for text terms. Inverted indices scale exponentially with unique term counts, causing massive RAM and SSD inflation during high-cardinality bursts.
- Columnar Compression: Telemetry attributes are partitioned into micro-partitions and stored by column. Because consecutive values in a single column (e.g.,
app.build_versionorhttp.status_code) have high statistical similarity, Zstandard and dictionary compression achieve 80% to 92% storage reduction. - Parallel Distributed Brute-Force Scans: When a query is initiated, Retriever fans out execution across thousands of stateless worker cores in AWS EC2, reading only the relevant columns from high-speed NVMe flash and S3 tiers, completing complex aggregations over billions of events in under 2.5 seconds.
"timestamp": "2026-11-08T03:14:22.842Z",
"trace.trace_id": "4bf92f3577b34da6a3ce929d0e0e4736",
"trace.span_id": "00f067aa0ba902b7",
"name": "checkout.process_payment",
"duration_ms": 1842.15,
// High-Cardinality Custom Business Attributes (Zero Surcharge in Honeycomb)
"app.customer_id": "cust_enterprise_88921",
"app.cart_id": "cart_uuid_09a8f211-92b0-4591",
"app.cart_value_usd": 4299.50,
"app.payment_gateway": "stripe_connect",
"app.retry_count": 3,
"app.circuit_breaker_tripped": true,
"app.feature_flag.new_fraud_engine": "variant_b_ml_v3",
// Infrastructure & Runtime Dimensions
"k8s.pod.name": "payment-svc-78f99d6d45-k8zlw",
"k8s.node.name": "ip-10-0-142-88.ec2.internal",
"host.arch": "arm64",
"process.runtime.version": "go1.25.1",
"net.peer.name": "api.stripe.com",
"net.peer.latency_ms": 1790.80
}
The Outlier Tail: Why Metric Downsampling Destroys P99 and P99.9
When Datadog aggregates metrics over time, it computes mathematical summaries (average, min, max, sum, and approximate t-digest percentiles). However, once raw events are discarded into pre-computed histograms, the multidimensional correlation between attributes is permanently lost.
If an average response time is 45ms, but 0.1% of transactions take 8,500ms, a traditional metric graph will show a mild ripple on the p99 line. An on-call engineer cannot ask the metric graph: "Which customer IDs or which container IP addresses are responsible for that specific 8,500ms spike?" To find out, the engineer must jump from the metric dashboard to the log explorer, hope that logging was enabled at DEBUG level, construct a Lucene query, and manually align timestamps. In Honeycomb, the trace span is the event. Clicking the outlier in a heatmap immediately exposes every attribute attached to that exact transaction.
3. Query Engine & Root Cause Analysis: BubbleUp vs Datadog Watchdog
Both Honeycomb and Datadog incorporate machine-assisted anomaly detection, but their algorithmic designs serve entirely different incident response workflows.
Honeycomb BubbleUp: High-Dimensional Non-Parametric Divergence
Honeycomb’s flagship diagnostic innovation is BubbleUp. Unlike traditional AI engines that alert you after something has already broken, BubbleUp is an interactive investigative tool used during active incident triage.
When an engineer identifies a cluster of anomalous requests—such as a cluster of high-latency dots in a latency heatmap—the engineer draws a bounding box around the anomalous events. In real time, BubbleUp partitions the entire dataset into two populations:
- Selection Population ($P$): All events inside the highlighted bounding box (the outliers).
- Baseline Population ($Q$): All events outside the bounding box across the identical time interval (the healthy baseline).
Retriever then computes the statistical divergence across every single recorded dimension simultaneously—whether the dataset contains 50 dimensions or 800 dimensions. For categorical dimensions, it calculates frequency delta distributions and metric cross-entropy; for numerical dimensions, it computes two-sample Kolmogorov-Smirnov (KS) test statistics:
Within 1.5 seconds, BubbleUp renders a ranked list of horizontal distribution graphs sorted by statistical divergence. The engineer immediately sees that while 99% of attributes (like http.method, os.type, or aws.region) have identical distributions between healthy and slow requests, a single dimension—for example, app.feature_flag.new_fraud_engine = variant_b_ml_v3—is present in 100% of the outlier selection and 0% of the baseline. Root cause identification shifts from a 45-minute tribal hypothesis guessing game to a single mouse stroke.
Datadog Watchdog: Seasonal Time-Series ML & Proactive Alerting
Datadog’s AI engine, Watchdog, takes a macroscopic, proactive approach. Watchdog runs automated machine learning algorithms (employing auto-regressive seasonal decomposition, Kalman filters, and gradient-boosted trees) across metric streams, error rates, and APM throughput.
Watchdog continuously scans for anomalies that deviate from historical cyclical baselines—for example, detecting that database query latency on a Tuesday afternoon is 40% higher than typical Tuesday averages, even if no static alerting threshold was crossed. Watchdog also generates:
- Watchdog Insights: Automated badges in dashboards highlighting anomalous tag values (e.g., higher error rate on
availability-zone:us-east-1a). - Root Cause Analysis (RCA) Stories: Grouping related alerts across infrastructure, logs, and APM traces into a single correlated timeline.
- Bits AI Assistant: A natural-language interface capable of querying metric states, summarizing incident status, and suggesting runbook remediation steps.
The Architectural Trade-off: Watchdog excels at detecting "known-unknown" patterns—alerting the NOC team that an outage is developing before user complaints surge. However, during a novel failure (a "gray failure" or cascade caused by subtle concurrency locks across microservices), Watchdog frequently presents dozens of correlated anomalies without being able to prove causality, because it cannot dynamically compute non-parametric divergence across unindexed, arbitrary customer identifiers.
4. Tracing & Tail Sampling Strategies: Honeycomb Refinery vs Datadog
At scale, distributed tracing presents a brutal economic constraint: in a system handling 200,000 requests per second, instrumenting 100% of spans produces petabytes of data daily. No enterprise budget can support ingesting and storing every single successful HTTP 200 health check. Consequently, sampling is mandatory.
Head-Based Sampling vs Tail-Based Sampling
Traditional APM tools historically relied upon head-based sampling: the moment an HTTP request hits the API gateway, a random dice roll determines whether the trace should be captured (e.g., sample 1 out of every 100 requests).
The Head-Sampling Flaw: If an intermittent database deadlock occurs in 1 out of 10,000 requests (0.01% error rate), a 1% head-based sampling policy has a 99% probability of discarding the failed trace entirely. The engineer is left debugging an outage with zero diagnostic traces.
To solve this, modern architectures utilize tail-based sampling: telemetry is buffered in memory until the entire distributed transaction finishes. Once the trace is complete, a sampling policy evaluates the outcome. Traces containing HTTP 500 errors, panics, unhandled exceptions, or latency exceeding predefined SLAs are preserved at 100%, while routine, successful requests are downsampled.
Honeycomb Refinery: Distributed Intelligent Tail Sampling
Honeycomb delivers tail-based sampling through Refinery, an open-source, highly scalable proxy cluster that customers deploy within their own cloud environment (Kubernetes, AWS ECS, or GCP).
Refinery nodes use peer-to-peer hashing (consistent hashing via Redis or memberlist) to route all spans sharing the same trace_id to the exact same Refinery worker node. The node buffers the trace in RAM for a configurable evaluation window (typically 3 to 10 seconds). Once the trace is assembled, Refinery applies dynamic, rules-based logic.
Samplers:
__default__:
DeterministicSampler:
SampleRate: 10
production_rules:
RulesBasedSampler:
Rules:
# Rule 1: Always keep 100% of errors and server exceptions
- Name: "keep_5xx_errors"
SampleRate: 1 # 1:1 keep everything
Conditions:
- Field: "http.status_code"
Operator: ">="
Value: 500
# Rule 2: Always keep 100% of extreme latency outliers (P99.9)
- Name: "keep_slow_traces"
SampleRate: 1
Conditions:
- Field: "duration_ms"
Operator: ">="
Value: 2500
# Rule 3: Keep 100% of VIP enterprise tier customers
- Name: "keep_vip_tenants"
SampleRate: 1
Conditions:
- Field: "customer.tier"
Operator: "="
Value: "enterprise_vip"
# Rule 4: Aggressively sample health checks and probes
- Name: "sample_health_checks"
SampleRate: 1000 # Keep only 1 out of every 1000
Conditions:
- Field: "http.target"
Operator: "in"
Value: ["/healthz", "/readyz", "/metrics"]
# Rule 5: Dynamic throughput sampling (EMA) for normal traffic
- Name: "dynamic_normal_traffic"
EMASampler:
GoalThroughputPerSec: 500
FieldList: ["http.route", "http.status_code"]
Datadog Ingestion Controls & Retention Filters
Datadog splits tracing costs into two distinct billing vectors:
- Ingested Spans: The Datadog Agent sends traces to Datadog's cloud ingest. Every gigabyte of spans ingested is billed at $0.10/GB (after a standard 150GB per host allotment).
- Indexed Spans: Once ingested, Datadog applies Retention Filters in the cloud to determine which spans are indexed into the searchable APM store for 15 days. Retained spans cost $1.70 per million indexed events.
The FinOps Reality: In Datadog, tail-based decisions happen primarily in the cloud after the data has already crossed the network into Datadog's ingest pipes, incurring network transfer and ingestion fees. With Honeycomb Refinery, tail sampling executes inside your own network perimeter—meaning filtered-out telemetry is discarded before ever hitting the Internet, drastically slashing egress bandwidth and cloud SaaS billing.
5. OpenTelemetry (OTel) Native vs Proprietary Agent Ecosystem
The agent layer determines long-term vendor lock-in, deployment friction, and host CPU/RAM overhead across your Kubernetes clusters.
Honeycomb: The 100% OpenTelemetry Native Philosophy
Honeycomb made a decisive architectural pivot: they deprecated their proprietary SDKs (such as Beeline) in favor of the Cloud Native Computing Foundation (CNCF) OpenTelemetry standard.
Honeycomb runs no proprietary host agent. Telemetry is collected using standard OpenTelemetry SDKs embedded in your application runtimes (Java, Go, Python, Node.js, .NET, Rust) and streamed via the vendor-neutral OpenTelemetry Protocol (OTLP over gRPC or HTTP/protobuf). If an organization decides to leave Honeycomb in the future, not a single line of application instrumentation code needs to be altered; only the OTLP exporter endpoint in the Collector configuration is modified.
Datadog Agent (v7): Monolithic Omnipresence
The Datadog Agent is an engineering marvel of breadth, but it is architecturally heavyweight. Deployed typically as a Kubernetes DaemonSet, the agent binary bundles:
core-agent: Collects host, container, and cloud provider metrics.trace-agent: Ingests proprietary APM spans and handles local trace aggregation.process-agent: Inspects every running process, thread, and container cgroup.system-probe: Uses eBPF kernel bytecode to track socket connections, TCP retransmissions, and network flows.security-agent: Performs file integrity monitoring and Cloud Security Posture Management.
While Datadog now supports OTLP ingestion within the Datadog Agent, the internal data model transforms OTel semantic conventions into Datadog tags and custom metrics. Furthermore, running the full Datadog Agent suite routinely consumes 450MB to 900MB of RAM per Kubernetes worker node, compared to a streamlined OpenTelemetry Collector DaemonSet consuming just 80MB to 160MB of RAM.
otlp:
protocols:
grpc: { endpoint: "0.0.0.0:4317" }
http: { endpoint: "0.0.0.0:4318" }
processors:
batch:
timeout: 1s
send_batch_size: 1024
memory_limiter:
check_interval: 1s
limit_percentage: 75
spike_limit_percentage: 20
exporters:
# Exporter A: Honeycomb OTLP Endpoint
otlp/honeycomb:
endpoint: "api.honeycomb.io:443"
headers:
"x-honeycomb-team": "${env:HONEYCOMB_API_KEY}"
"x-honeycomb-dataset": "production-microservices"
# Exporter B: Datadog Exporter via Native API
datadog:
api:
key: "${env:DATADOG_API_KEY}"
site: "datadoghq.com"
service:
pipelines:
traces:
receivers: [otlp]
processors: [memory_limiter, batch]
exporters: [otlp/honeycomb, datadog]
metrics:
receivers: [otlp]
processors: [memory_limiter, batch]
exporters: [otlp/honeycomb, datadog]
6. Infrastructure Monitoring, Synthetic Testing, & Operational Scope
When choosing between these platforms, enterprise leaders must decide between a specialized best-of-breed observability engine and a broad IT operations platform.
Datadog's Monolithic Breadth
Datadog's paramount competitive advantage is its all-in-one scope. Beyond APM and distributed tracing, Datadog offers turnkey solutions for:
- 750+ Pre-built Integrations: One-click integrations for AWS, GCP, Azure, Cisco, Kafka, Redis, PostgreSQL, Nginx, Snowflake, and Kubernetes with pre-configured dashboards and alerting thresholds.
- Network Performance Monitoring (NPM): eBPF-driven visibility into connection states, latency, throughput, and DNS resolution failures between individual pods and external IP ranges without code modifications.
- Synthetic Monitoring: Headless Chromium browser automation executing multi-step user checkout scripts across 25+ global geolocations, accompanied by HTTP/SSL endpoint health checks.
- Database Monitoring (DBM): Deep query plan explainers, lock wait analysis, and normalized SQL performance profiling for Postgres, MySQL, Oracle, and SQL Server.
- Cloud Security Management (CSM & SIEM): Real-time threat detection mapping AWS CloudTrail, audit logs, and container drift against CIS benchmarks and MITRE ATT&CK frameworks.
Honeycomb's Deliberate Focus
Honeycomb deliberately rejects the monolithic suite strategy. Honeycomb does not offer an eBPF network packet sniffer, a SIEM log correlation compliance engine, or synthetic browser testing scripts.
Instead, Honeycomb treats everything as an event. Infrastructure metrics (CPU, RAM, disk I/O, Kubernetes kube-state-metrics) are ingested via the OpenTelemetry Collector as metric events. Once inside Retriever, infrastructure metrics can be queried with identical sub-second speed and correlated directly with trace spans. Honeycomb also features first-class Service Level Objectives (SLOs) with real-time Burn Rate Alerts, allowing SRE teams to measure true user-facing error budgets rather than triggering false-positive alerts on transient CPU spikes.
Architecture Verdict: If your organization requires a central NOC dashboard to monitor 5,000 legacy Windows VMs, physical Cisco switches, and SaaS cloud invoices, Datadog is irreplaceable. If your organization is modernizing its application tier and wants to emancipate software engineers from dashboard overload to debug complex distributed applications, Honeycomb delivers radically superior engineering depth.
7. FinOps Cost Modeling & 3-Year Total Cost of Ownership (TCO)
The economic structures of Honeycomb and Datadog represent two completely antithetical pricing models: unified event volume versus multi-metered SKU aggregation.
Deconstructing Datadog's Multi-Metered SKU Nightmare
Datadog’s pricing appears deceptive at first glance. Enterprise sales proposals emphasize a $15/host infrastructure tier and a $31/host APM tier. However, enterprise invoices inevitably balloon due to secondary and tertiary consumption meters:
- Custom Metrics Surcharges: Datadog allocates 100 custom metrics per host. Beyond that threshold, every 100 metric time series costs $5.00 per month. If an engineer tags a latency metric with a high-cardinality dimension, the formula for monthly custom metric overage is:
Cost_{metrics} = \max\left(0, \frac{M_{total} - (100 \times N_{hosts})}{100}\right) \times \$5.00In microservice environments with ephemeral containers, dynamic tags frequently trigger tens of thousands of dollars in unbudgeted custom metric overages.
- Ingested vs Indexed Logs: Ingesting raw logs costs $0.10/GB. Retaining and indexing logs costs $1.06 per million log events (3-day retention), $1.70 per million (15-day retention), or $2.50 per million (30-day retention).
- Synthetic Runs: $5.00 per 10,000 API tests, and $12.00 per 1,000 browser test executions.
- APM Ingested Spans: $0.10/GB ingested beyond the 150GB/host free allowance.
Honeycomb's Transparent Event Economy
Honeycomb charges strictly for one primary unit: Event Volume.
- Free Tier: 20 million events per month, 100% full features, unlimited users.
- Pro Tier: Starts at $130 per month for 20 million events, scaling in predictable blocks.
- Enterprise Tier: Committed annual event volume contracts with guaranteed tiered discounts.
- Unlimited Seats: Zero user license fees. Every engineer, product manager, and customer support specialist can query Honeycomb without incremental seat cost.
- Zero Custom Metric Penalties: A single event can carry 300 custom high-cardinality dimensions with no incremental fee.
- Predictable Control via Refinery: By tuning tail-sampling rules in Refinery, engineering leadership directly regulates event ingestion volume, maintaining strict budget ceilings.
3-Year Enterprise TCO Simulation
The following table models a realistic 3-year FinOps total cost of ownership across three corporate operating scales:
| Operating Scale Scenario | Infrastructure Profile | Honeycomb 3-Year TCO | Datadog 3-Year TCO | FinOps Variance |
|---|---|---|---|---|
| Scenario A: Mid-Market Cloud Native | 50 K8s nodes, 15 microservices, 40 engineers, 60M events/day (tail-sampled 10:1 to 6M/day). | $78,400 | $164,200 | Honeycomb 52% Cheaper |
| Scenario B: Scale-Up FinTech | 250 K8s nodes, 80 microservices, 150 engineers, 600M events/day (sampled via Refinery to 45M/day). | $324,000 | $785,000 | Honeycomb 58% Cheaper |
| Scenario C: Global Enterprise Estate | 1,200 nodes / VMs, 350 microservices, 500 engineers, 3B raw events/day (Refinery sampled to 220M/day). | $1,180,000 | $2,890,000 | Honeycomb 59% Cheaper |
8. Comprehensive 25-Row Architectural Comparison Matrix
A rigorous technical breakdown evaluating Honeycomb and Datadog across 25 structural dimensions spanning data models, indexing, sampling fidelity, infrastructure coverage, security standards, and financial predictability.
| Evaluation Dimension | Honeycomb | Datadog | Advantage |
|---|---|---|---|
| 1. Core Telemetry Philosophy | Unified wide structured events; arbitrary JSON dimensionality; exploratory debugging. | Three distinct pillars (time-series metrics, text logs, APM spans) aggregated into correlated dashboards. | Honeycomb |
| 2. Primary Billing & Metering Unit | Single event volume meter (number of wide events ingested); zero seat charges. | Multi-metered: per-host fees + custom metric tags + log ingest/index + trace index tiers. | Honeycomb |
| 3. Cardinality Support & Limits | Virtually unlimited cardinality. Billions of distinct values per field without performance drop. | Strict cardinality constraints. 100 custom metrics per host before steep financial overages. | Honeycomb |
| 4. Index Management Overhead | Zero indexing required. Retriever columnar engine performs brute-force parallel queries over raw data. | Manual index management, log retention filters, and custom metric tag configuration required. | Honeycomb |
| 5. Automated Root Cause Engine | BubbleUp: Non-parametric multi-dimensional divergence calculation across all fields simultaneously. | Watchdog: Time-series ML forecasting, anomaly detection, and correlation heuristic grouping. | Honeycomb |
| 6. Anomaly Detection Methodology | User-guided distribution comparison (Kolmogorov-Smirnov / Mutual Information) in sub-second queries. | Proactive background statistical anomaly alerts based on historical cyclical seasonality. | Datadog |
| 7. Trace Sampling Architecture | Refinery proxy cluster: In-VPC tail-based sampling, keeping 100% of errors/slow spans before cloud egress. | Agent head sampling + cloud ingestion controls ($0.10/GB) + cloud retention filters ($1.70/M indexed). | Honeycomb |
| 8. Distributed Tracing Fidelity | Every span is a wide event with complete contextual attributes; no truncation of custom fields. | High trace fidelity, but auxiliary tags may be stripped to control index size and tag cardinality. | Honeycomb |
| 9. OpenTelemetry (OTel) Compatibility | 100% OTel-native. Deprecated proprietary SDKs; pure OTLP ingestion over gRPC/HTTP. Zero lock-in. | Supports OTLP ingestion, but translates attributes to proprietary tag schemes; favors Datadog Agent. | Honeycomb |
| 10. Agent Footprint & Memory Usage | No proprietary agent daemon. OTel Collector daemonset consumes ~80MB–160MB RAM per worker node. | Monolithic Datadog Agent DaemonSet (system-probe, trace, security) consumes 450MB–900MB RAM. | Honeycomb |
| 11. Infrastructure & Host Monitoring | Host metrics ingested as OTel events; lacks automated physical hardware discovery. | 750+ pre-built integrations, turnkey host dashboards, automated discovery, VMware, bare metal. | Datadog |
| 12. Kubernetes Cluster Visibility | OTel k8s cluster receiver ingestion; rich event correlation across pods and deployments. | Dedicated Kubernetes Cluster Explorer, Live Container view, eBPF network maps, Helm charts. | Datadog |
| 13. Log Ingestion & Query Model | Logs are ingested as structured events into Retriever; unified querying with traces and metrics. | Dedicated Log Management pipeline with Lucene index search, log pipelines, grok parsing, and archives. | Datadog |
| 14. Metric Pre-Aggregation | None. Queries evaluate raw event distributions on the fly; no resolution degradation over time. | Metrics are rolled up into time buckets (10s, 1m, 1h); historical raw event fidelity is discarded. | Honeycomb |
| 15. Query Language & Expressiveness | Derived columns (JavaScript-like syntax), mathematical expressions, and intuitive visual builder. | DogStatsD metric math, Log search syntax, DQL, and formula builder across multiple metric series. | Tie |
| 16. Heatmaps & Percentile Precision | Native sub-second heatmaps over raw distributions; visual selection with direct BubbleUp jump. | T-digest percentile estimates; heatmaps available but disconnected from automatic dimensional breakdown. | Honeycomb |
| 17. SLO & Error Budget Tracking | Real-time SLO error budget burn rate alerting; directly linked to high-cardinality drill-downs. | Service Level Objectives built on metrics or monitors; comprehensive dashboard widgets and reporting. | Tie |
| 18. Out-of-the-Box Dashboards | Basic starter boards; philosophy strongly discourages static dashboard sprawl in favor of queries. | Thousands of community and vendor out-of-the-box dashboards with exquisite layout flexibility. | Datadog |
| 19. Synthetic Monitoring Capabilities | No native synthetic browser or API test execution engine. | Full synthetic suite: global headless Chrome browser steps, multi-location API tests, SSL verification. | Datadog |
| 20. Real User Monitoring (RUM) & Replay | Honeycomb for Frontend (web OTel instrumentation); captures Core Web Vitals as events. | Comprehensive RUM with session replay video simulation, frustration clicks, and mobile SDKs. | Datadog |
| 21. Database & Network Visibility | Database spans captured via OTel; no kernel socket-level NPM packet inspection. | Deep DBM (execution plans, lock analysis) and eBPF Network Performance Monitoring (NPM). | Datadog |
| 22. Cloud Security & SIEM (SecOps) | No native security information management or compliance scanning module. | Cloud SIEM, Cloud Security Posture Management (CSPM), container runtime security (CWS). | Datadog |
| 23. Data Privacy & Zero Retention | Secure Tenancy: In-VPC KMS encryption proxy. Data is ciphertext before leaving customer network. | Sensitive Data Scanner: Ingestion regex scrubbing; data stored in regional Datadog public clouds. | Honeycomb |
| 24. User Licenses & Seat Pricing | Unlimited seats on all plans. No per-seat tax; democratizes observability across entire engineering. | Account-level user management; enterprise features often gated by seat-based billing or role tiers. | Honeycomb |
| 25. 3-Year FinOps Cost Predictability | Highly predictable. Single volume metric governed by Refinery sampling rules. No overage spikes. | Low predictability. High risk of invoice shock from custom metric tag leaks or log surges. | Honeycomb |
9. Enterprise Security, Code Privacy, Data Retention & Compliance
When streaming distributed traces from critical production microservices, application payloads inevitably intersect with sensitive customer data—including Personally Identifiable Information (PII), payment tokens, medical identifiers, or intellectual property. Evaluating enterprise compliance postures is essential.
Honeycomb Secure Tenancy: Architectural Zero Data Exposure
For healthcare providers (HIPAA), financial payment gateways (PCI-DSS Level 1), and defense contractors, streaming unencrypted distributed trace attributes to a third-party multi-tenant SaaS provider violates regulatory data sovereignty.
Honeycomb addresses this through Secure Tenancy. Rather than transmitting raw events directly to Honeycomb’s cloud ingestion endpoints, telemetry passes through a customer-managed Secure Tenancy Proxy deployed inside the enterprise's private cloud VPC or on-premises DMZ.
- Customer-Held Encryption Keys: The proxy integrates with AWS KMS, HashiCorp Vault, or Azure Key Vault to generate symmetric cryptographic keys that never leave the customer’s security perimeter.
- In-Flight Attribute Tokenization: All string attribute values and payload descriptions are encrypted into cryptographic hashes before transmission over the public Internet.
- Zero Plaintext Storage in SaaS: Honeycomb’s Retriever engine stores, indexes, and aggregates strictly the ciphertext tokens. Honeycomb employees and cloud infrastructure operators have mathematically zero access to the underlying plaintext data.
- Client-Side In-Memory Decryption: When an authorized engineer opens Honeycomb in a browser, a lightweight local decryption extension uses the customer’s private key to decrypt the display labels in browser memory on the fly.
Datadog Sensitive Data Scanner (SDS) & Global Compliance
Datadog provides enterprise compliance through its Sensitive Data Scanner (SDS), an in-stream regex parsing engine that operates within Datadog’s ingestion pipeline:
- Rule-Based Obfuscation: SDS scans incoming log streams, APM spans, and RUM sessions against pre-packaged pattern libraries (credit card numbers, social security numbers, API keys, JWT tokens) or custom regexes, automatically masking, hashing, or dropping sensitive fields prior to cloud storage.
- Compliance Certifications: Datadog maintains rigorous enterprise accreditations, including SOC 2 Type II, ISO 27001, ISO 27017, ISO 27018, and HIPAA BAA availability.
- FedRAMP High & Government Cloud: Datadog operates dedicated sovereign cloud zones—including Datadog Government Cloud (FedRAMP High Authorized)—enabling federal agencies and defense industrial base entities to maintain strict legal compliance. Honeycomb holds FedRAMP Moderate authorization.
10. Frequently Asked Questions (FAQ)
11. Enterprise Migration Blueprint: Datadog to Honeycomb Without Downtime
Transitioning mission-critical production systems from Datadog to Honeycomb requires a structured, phased methodology to prevent telemetry blackouts and ensure engineering adoption.
Phase 1: OpenTelemetry Decoupling & Dual-Shipping (Days 1–30)
Do not rip out the Datadog Agent immediately. Instead, deploy an OpenTelemetry Collector gateway cluster inside your Kubernetes environments. Migrate application runtimes from proprietary Datadog tracing libraries (dd-trace-py, dd-trace-java, dd-trace-go) to standardized OpenTelemetry SDKs with OTLP exporters.
Configure the OTel Collector to fan out telemetry: export traces to Honeycomb while simultaneously routing them to Datadog via the collector's datadogexporter. This ensures zero disruption to existing Datadog monitors while the engineering team gains confidence with Honeycomb.
Phase 2: Deploy Honeycomb Refinery & Tune Tail Sampling (Days 31–45)
Deploy a redundant Refinery cluster (2+ nodes behind an internal load balancer). Direct the OpenTelemetry Collector's OTLP exporter to Refinery. Establish your initial deterministic sampling rules: guarantee 100% capture for errors, panics, and traces exceeding p95 latency thresholds, while configuring an EMA dynamic sampler for high-volume 200 OK endpoints. Monitor your event consumption in Honeycomb's Usage Center to calibrate monthly commit targets.
Phase 3: Service Level Objectives & Dashboard Deprecation (Days 46–60)
Replace fragile, alert-fatiguing Datadog metric threshold monitors with Honeycomb Service Level Objectives (SLOs) anchored by error budget burn rates. Train on-call rotations to use BubbleUp as the primary diagnostic reflex during incident triage. Once engineers instinctively rely on BubbleUp for mean-time-to-resolution, decommission Datadog APM and custom metric ingestion, restricting Datadog—if retained at all—strictly to infrastructure host and cloud audit logging.
José Andrade
Staff Systems Architect & FinOps ModelerFounder and Managing Editor at CloudBizStack. José specializes in distributed tracing architectures, high-cardinality telemetry pipelines, OpenTelemetry deployments, and quantitative SaaS FinOps total cost of ownership modeling.