Cloud FinOps Guide: AWS, GCP & Kubernetes Cost Optimization (2026)
The era of unchecked, brute-force cloud expansion is officially over. In 2026, engineering leadership is judged not merely by deployment velocity, but by unit economics, gross margin sustainability, and capital efficiency. As microservice sprawling, high-cardinality observability pipelines, cross-AZ data transfers, and oversized Kubernetes clusters consume massive operational budgets, organizations require structural architectural interventions. This strategic, technical guide provides an exhaustive engineering blueprint to audit, right-size, refactor, and govern cloud infrastructure across AWS, Google Cloud Platform (GCP), and Kubernetesdelivering sustained 35% to 48% net cost reductions without compromising reliability or p99 latency SLAs.
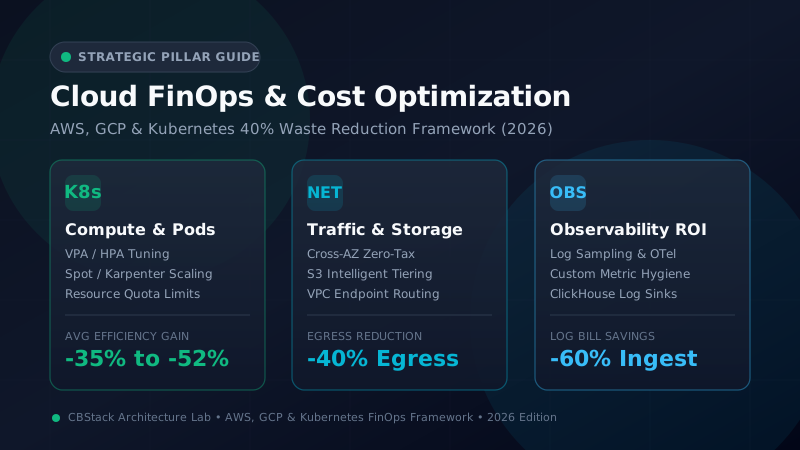
Early-Stage & Growth Tier ($10k$30k/mo spend): Focus ruthlessly on low-hanging architectural waste. Eliminate idle staging environments with scheduled scale-to-zero crons, convert all legacy Amazon EBS gp2 volumes to gp3 via automated Boto3 scripts for an instant 20% block storage saving, deploy Amazon S3 Gateway Endpoints (100% free) to bypass NAT Gateway data processing fees ($0.045/GB), and commit 70% of static baseline compute to 1-year or 3-year Compute Savings Plans. Immediate projected savings: 32% to 38%.
Mid-Market SaaS Tier ($50k$150k/mo spend): Modernize your Kubernetes compute fabric. Replace legacy Cluster Autoscalers and static Managed Node Groups with Karpenter, unlocking dynamic multi-architecture bin-packing (AWS Graviton c7g/m7g ARM64 nodes) and aggressive Spot instance orchestration for stateless replicas backed by graceful termination handlers. Deploy edge telemetry collection (Vector or OpenTelemetry Collector) to filter high-frequency health checks and debug logs before ingestion into Datadog, cutting observability tax by 50%. Immediate projected savings: 40% to 45%.
Enterprise & Scale-Up Tier ($250k$1M+/mo spend): Implement structural network and data governance. Enforce Kubernetes Topology-Aware Routing alongside eBPF networking (Cilium eBPF) to eliminate 75%+ of cross-AZ network egress ($0.02/GB round-trip), decommission unmonitored AWS Transit Gateway data processing routes in favor of Direct VPC Peering, decouple hot log analytics from cold archive storage with ClickHouse and S3 Glacier Deep Archive, and automate shift-left CI/CD pull request cost diffs with Infracost. Projected annual enterprise savings: $1.2M to $4.8M+.
Table of Contents
- 1. The Macro Economics of Cloud in 2026
- 2. The 4 Dimensions of Cloud Waste
- 3. Kubernetes Compute Optimization & Karpenter
- 4. The Cross-AZ & Egress Network Tax
- 5. Storage Lifecycle FinOps: S3 & EBS gp3
- 6. Observability & Telemetry FinOps
- 7. Commitment-Based Discount Engineering
- 8. Comprehensive FinOps Tooling Landscape
- 9. Contextual Benchmark Synergy & Cross-Links
- 10. 3-Year Enterprise TCO Mathematical Models
- 11. Step-by-Step 90-Day Cloud Cost Playbook
- 12. Enterprise Governance, Allocation & Culture
- 13. Frequently Asked Questions (FAQ)
1. The Macro Economics of Cloud in 2026: Why Unit Economics Replaced Brute-Force Expansion
Between 2018 and 2022, the prevailing doctrine across venture-backed technology companies and enterprise digital transformation programs was unconstrained speed to market. Cloud infrastructure was treated as an elastic, virtually infinite resource pool where developer velocity eclipsed gross margin considerations. If a database query was unindexed or a microservice suffered from memory leaks, engineering teams simply doubled the instance size, moving from an m5.xlarge to an m5.4xlarge. The cost of infrastructure was dismissed as an accounting detail subsumed by revenue growth.
In 2026, the macro-economic reality is fundamentally inverted. Higher capital costs, disciplined equity markets, and compressed enterprise software multiples have forced Chief Financial Officers (CFOs) and Chief Technology Officers (CTOs) to scrutinize cloud spend not as a routine utility bill, but as the single largest variable component of Cost of Goods Sold (COGS). Uncontrolled cloud expenditure directly erodes corporate gross margins, directly impairing corporate valuation multiples. A SaaS business operating at 65% gross margin trades at a severe discount compared to a peer executing at 82% gross margin on identical top-line ARR.
Legacy Model Brute-Force Expansion (20182022)
- Growth at all costs; cloud spend considered an unavoidable operational overhead.
- Engineers overprovision Pod requests by 300% to 500% to prevent midnight pager alerts.
- Aggregate monthly AWS/GCP invoice reviewed in isolation without business context.
- Observability agents ingest petabytes of uncompressed debug logs blindly.
- Zero accountability: No developer feedback loops at pull-request merge time.
Modern Model Unit Economics Engineering (2026)
- FinOps maturity: Continuous alignment of finance, operations, and platform engineering.
- Autonomous bin-packing with Karpenter, Graviton silicon, and aggressive Spot orchestration.
- Infrastructure spend correlated directly to revenue-generating business units.
- Decoupled edge telemetry pipelines (Vector/OTel) routing 90% of raw data to cold S3 sinks.
- Shift-left FinOps: Automated Infracost cost diffs blocking expensive IaC changes in CI/CD.
The FinOps Foundation Framework Evolution
The FinOps Foundation defines FinOps as an operational framework and cultural practice that maximizes the business value of cloud, enables data-driven decision-making, and creates financial accountability through collaboration between engineering, finance, and technology leadership. Historically categorized into three discrete phasesInform, Optimize, and Operatethe 2026 enterprise standard has evolved from reactive retrospective auditing into continuous, automated closed-loop systems.
In mature organizations, the "Inform" phase no longer relies on monthly PDF invoices delivered 15 days after month-end. Instead, Kubernetes allocation engines such as OpenCost and Kubecost vs CAST AI ingest real-time AWS billing APIs, mapping CPU cycles, memory allocations, and network egress down to specific namespaces, StatefulSets, and customer tenant IDs. The "Optimize" phase has transitioned from manual spreadsheet ticketing to autonomous platform controllers that dynamically right-size pods, purchase commitment instruments, and convert legacy block storage volumes without human intervention.
Defining Rigorous Cloud Unit Economics
The fatal flaw of unoptimized infrastructure management is tracking aggregate spend in isolation. If a company's cloud invoice increases from $100,000 to $160,000 per month, executive leadership frequently panics over a 60% spending explosion. However, if active transacting users grew by 250% over the identical timeframe, the company's cloud cost per transaction actually dropped by 43%. Conversely, a static $80,000 monthly invoice represents catastrophic inefficiency if customer volume declined by half.
To establish engineering-grade financial governance, organizations must define and measure four primary unit economic metrics:
Metric 2: Unit Cost per Monthly Active Tenant ($/Tenant) U_{Tenant} = \frac{C_{DedicatedTenantInfra} + (C_{SharedPlatformInfra} \times \omega_{TenantWeight})}{N_{ActiveTenants}}
Metric 3: Observability-to-Compute Tax Ratio (Target: < 8% to 10%) R_{Observability} = \frac{C_{Datadog} + C_{Dynatrace} + C_{CloudWatch} + C_{ManagedPrometheus}}{C_{TotalCompute}} \times 100\%
Tracking the Observability-to-Compute Tax Ratio is critical. In over 70% of audits conducted on mid-market SaaS platforms spending between $50k and $200k monthly, the combined cost of commercial APM, distributed tracing, and managed log aggregation exceeds 25% of their total raw EC2 and EKS compute spend. When an organization spends $30,000 on virtual machines and $12,000 on Datadog to monitor those exact virtual machines, the monitoring tooling has ceased to be an operational safeguard and has become an existential gross-margin parasite.
The Executive FinOps Alignment Triad
Successful cloud financial engineering requires breaking down the historical adversarial dynamic between finance and engineering. Platform teams must construct an operational triad where incentives are mathematically aligned:
- The Chief Financial Officer (CFO): Demands predictable OPEX forecasting, GAAP-compliant asset amortization, elimination of billing surprises, and maximum utilization of commitment instruments (Savings Plans and Committed Use Discounts) to protect gross margins.
- The VP of Engineering / Head of Platform: Demands strict preservation of customer-facing p99 latency SLAs, zero downtime during autoscaling events, high developer velocity, and zero disruption from manual infrastructure ticketing.
- The FinOps Lead / Principal FinOps Architect: Bridges the technical and financial domains. Converts finance commitments into automated platform policies, builds unit-cost attribution dashboards, enforces tagging hygiene via Policy-as-Code, and optimizes architectural topologies across network, compute, and storage.
Case Study FinFlow Payments: 62% Unit Margin Expansion
FinFlow, a global payment orchestration platform processing over 45 million transactions daily, faced an escalating cloud bill reaching $280,000 per month on AWS across three regions. Their unoptimized cloud cost per 1,000 transactions stood at $0.207. Over an 8-month FinOps engineering overhaul, FinFlow executed:
- Migrated stateless microservice pods from Intel x86_64 instances to AWS Graviton3 (
c7g.2xlargeandm7g.2xlarge), gaining a 20% direct price-performance advantage. - Replaced static Managed Node Groups with Karpenter, consolidating fragmented pod workloads and packing spot instances for worker queues.
- Deployed Cilium eBPF with Kubernetes Topology-Aware Routing, cutting cross-AZ transaction routing charges by 82%.
- Implemented an edge Vector pipeline routing 94% of raw transaction logs directly to Amazon S3 Standard-IA and cold ClickHouse storage, dropping Datadog ingestion costs from $48,000/mo to $11,500/mo.
Result: FinFlow's absolute monthly cloud bill plummeted from $280,000 to $128,000 while daily transaction volume grew 35%. Their unit cost per 1,000 transactions dropped from $0.207 to $0.070a massive 66% unit-cost reduction that immediately expanded corporate gross margins by 480 basis points.
2. The 4 Dimensions of Cloud Waste: Anatomy of the $100k/Month Cloud Bill
To systematically dismantle infrastructure waste, platform architects must understand the structural anatomy of modern cloud invoices. Cloud waste is rarely the result of a single catastrophic misconfiguration; rather, it is the compounding effect of micro-inefficiencies distributed across four primary technical vectors: Idle Compute, Cross-AZ & Egress Network Tax, Unmanaged Storage Tiers, and the Telemetry & Observability Tax.
Distribution of Structural Waste in an Unoptimized $100,000/Month Cloud Bill
Dimension 1: Idle & Overprovisioned Compute
Compute consistently represents the largest raw dollar line item in enterprise cloud spending, typically accounting for 45% to 65% of the gross invoice. Compute waste manifests in three distinct forms:
- The CPU & Memory Allocation Gap: Platform engineering audits across hundreds of Kubernetes clusters reveal that actual CPU utilization hovers between 12% and 18%, while memory utilization hovers around 35%. Application developers routinely set inflated Pod resource requests (e.g., requesting 4 vCPU and 8 GiB RAM for a microservice that consumes 350m vCPU and 1.2 GiB at peak) to guard against scheduling eviction or CPU throttling. Because the Kubernetes scheduler binds nodes based on requests rather than actual usage, clusters scale out dozens of unnecessary worker nodes.
- Zombie Workloads & Ghost Environments: Staging, QA, integration testing, and ephemeral pull request (PR) preview environments that run 24 hours a day, 7 days a week, 365 days a year. A development environment is actively utilized only 40 to 50 hours out of a 168-hour calendar week. Running idle clusters over nights and weekends wastes approximately 70% of non-production compute capital.
- Static Homogeneous Node Groups: Relying on legacy cloud provider Auto Scaling Groups populated with a single instance type (e.g., exclusively
m6i.2xlarge). This prevents clusters from utilizing diverse instance sizes, cheaper burstable instances, or modern ARM64 silicon.
Dimension 2: The Cross-AZ & Network Egress Tax
Public cloud providers market high-availability multi-Availability Zone (multi-AZ) architectures as an indispensable resilience best practice. What cloud sales representatives frequently omit from architectural reviews is that every gigabyte transferred across an AZ boundary incurs billing in both directions. In AWS, inter-AZ data transfer costs $0.01 per GB egress plus $0.01 per GB ingress, totaling $0.02 per GB ($20 per TB).
In a standard Kubernetes cluster deployed across three AZs (e.g., us-east-1a, us-east-1b, us-east-1c) without topology-aware routing, a client pod in AZ-1 communicating with a database or downstream microservice in AZ-2 or AZ-3 has a mathematical 66.7% probability of traversing an AZ boundary. For a high-throughput transactional system generating 200 TB of internal microservice and database traffic monthly, cross-AZ traffic alone generates $2,680/month in hidden network surchargescompounded further by AWS Transit Gateway and NAT Gateway data processing fees.
Dimension 3: Unmanaged Storage Tiers & Orphaned Ghost Volumes
Storage waste is cumulative, silent, and permanent unless actively purged by automated lifecycle policies. Storage waste typically concentrates in:
- Unattached EBS Volumes: When a StatefulSet or EC2 instance is terminated, attached EBS volumes are frequently retained due to default deletion policies (
DeleteOnTermination = false) to protect persistent data. Over quarters, hundreds of abandoned SSD volumes sit completely idle, accumulating monthly provisioned capacity charges ($0.08 to $0.10 per GB-month). - Orphaned Snapshot Chains: Automated backup scripts that generate daily EBS snapshots without retention expiration windows. Snapshots taken three years ago for decommissioned microservices continue to bill at standard S3 snapshot pricing ($0.05 per GB-month).
- Legacy gp2 Volume inertia: Retaining millions of gigabytes on legacy AWS gp2 volumes rather than migrating to gp3, voluntarily surrendering an instant 20% discount and decoupling IOPS performance from raw disk capacity.
- S3 Data Lakes without Lifecycle Tiering: Storing petabytes of raw application logs, database backups, and raw parquet files in Amazon S3 Standard ($0.023/GB) indefinitely, rather than automatically transitioning cold files to Glacier Flexible Archive ($0.0036/GB) or Glacier Deep Archive ($0.00099/GB) after 30 to 90 days.
Dimension 4: The Telemetry & Observability Tax
Commercial observability SaaS platforms operate on high-margin ingestion models that penalize engineering success. As microservice complexity grows, logging volume increases quadratically. Software engineers write verbose JSON log statements, emit high-frequency health checks, and attach high-cardinality metadata tags (such as raw user IDs, transaction UUIDs, or IP addresses) to Prometheus metrics.
Commercial vendors bill up to $0.10 to $0.50 per ingested gigabyte of logs, $1.70 per million indexed log events, and $5.00 per 100 custom metrics. Without edge filtering, log aggregation bills explode rapidly, frequently outpacing the cost of the underlying databases and compute clusters being monitored.
| Cloud Cost Category | Typical Unoptimized Spend | Root Cause of Waste | Optimized Target Spend | Net Savings % |
|---|---|---|---|---|
| Kubernetes Compute (EC2 / GCE) | $44,000 / mo | Oversized pod requests, static node pools, zero Spot adoption, x86_64 lock-in. | $25,500 / mo | 42.0% |
| Cross-AZ & Inter-VPC Network | $14,000 / mo | Round-robin pod routing across AZs, Transit Gateway data processing, public egress. | $3,500 / mo | 75.0% |
| NAT Gateway Data Processing | $6,500 / mo | S3 and DynamoDB traffic routed through NAT GW ($0.045/GB) rather than free Gateway Endpoints. | $800 / mo | 87.7% |
| Block Storage (EBS gp2/gp3) | $11,500 / mo | Legacy gp2 volumes, unattached orphaned volumes, overprovisioned IOPS. | $7,200 / mo | 37.4% |
| Object Storage (Amazon S3 / GCS) | $9,000 / mo | Zero lifecycle rules, cold data sitting on S3 Standard, unmanaged versioning delete markers. | $3,800 / mo | 57.8% |
| Observability & APM (Datadog/SaaS) | $15,000 / mo | Unfiltered debug logs, high-cardinality Prometheus labels, health check log ingestion. | $5,200 / mo | 65.3% |
| Total Monthly Cloud Infrastructure | $100,000 / mo | Compounded architectural waste across all 4 dimensions. | $46,000 / mo | 54.0% Net Reduction |
3. Kubernetes Compute Optimization: Autonomous Bin-Packing, Autoscaling & Silicon Architecture
Kubernetes has emerged as the universal compute operating system of the modern cloud. Consequently, achieving structural cost efficiency in Kubernetes dictates the financial trajectory of the entire cloud estate. Achieving high compute density requires replacing static manual provisioning with autonomous bin-packing, right-sizing pod resources, adopting event-driven scaling, orchestrating spot instances gracefully, and migrating to modern ARM64 silicon.
Right-Sizing Pod Requests vs. Limits: The CFS Quota Reality
One of the most persistent architectural misunderstandings in cloud engineering centers on how the Linux kernel enforces Kubernetes CPU requests and limits. In Kubernetes:
- CPU Requests: Implemented via the Linux
cpu.sharescontrol group (cgroup) parameter. It dictates relative scheduling priority when physical CPU is contested. Crucially, the Kubernetes scheduler (kube-scheduler) sums Pod CPU requestsnot actual usageto determine if a node has capacity to host a pod. - CPU Limits: Implemented via the Completely Fair Scheduler (CFS) bandwidth control subsystem using
cpu.cfs_quota_usandcpu.cfs_period_us. If a container's limit is set to1000m(1 vCPU) and the period is 100ms, the container is allocated 100ms of CPU run-time per 100ms period.
When multi-threaded microservices (such as Java JVM, Go runtimes, or Node.js event loops) burst across 8 or 16 OS threads, they can exhaust their 100ms CFS quota within the first 12ms of the period. The Linux kernel immediately puts all threads to sleep for the remaining 88ms. This phenomenonknown as CFS CPU throttlingtriggers severe latency spikes and HTTP timeouts even when node-level CPU utilization is sitting below 30%.
The FinOps Architectural Standard for Pod Sizing:
- Set CPU Requests based on p95/p99 historical consumption with a 20% to 30% safety buffer.
- Eliminate CPU Limits on non-multi-tenant general workloads or utilize Kubernetes CFS Quota Bursting. Removing CPU limits allows pods to burst into idle node capacity without throttling, eliminating artificial latency spikes.
- Always enforce strict Memory Limits equal to Memory Requests. Unlike CPU, memory cannot be throttled. When a node exhausts physical memory, the Linux Out-Of-Memory Killer (OOMKiller) terminates processes abruptly. Setting
requests.memory == limits.memoryguarantees the Guaranteed Quality of Service (QoS) class, shielding mission-critical pods from eviction.
Autonomous Request Sizing with VPA & Fairwinds Goldilocks
Manually tuning CPU and memory values for 200+ microservices across multiple deployment stages is operationally impossible. Organizations must deploy the Vertical Pod Autoscaler (VPA) in recommendation mode alongside dashboards like Fairwinds Goldilocks. The VPA recommender observes historical resource consumption profiles over 8-day rolling windows, applying decay algorithms to calculate optimal request baselines:
Event-Driven Autoscaling with KEDA
Standard Kubernetes Horizontal Pod Autoscalers (HPA) scale workloads based on average CPU or Memory utilization. In modern event-driven architectures, CPU utilization is a lagging indicator. By the time consumer microservices experience CPU spikes from an incoming batch of Kafka messages, the queue has already accumulated thousands of unprocessed events, degrading customer experience.
Deploying KEDA (Kubernetes Event-driven Autoscaling) enables pods to scale from zero to hundreds of replicas based on real-time business telemetrysuch as Kafka topic consumer lag, AWS SQS queue length, or Redis stream backlogs. When message queues empty, KEDA scales consumer deployments down to zero or a minimal baseline, eliminating idle compute consumption during non-peak hours:
Karpenter vs. Cluster Autoscaler: The Autonomous Bin-Packing Revolution
For nearly a decade, the standard tool for sizing Kubernetes clusters was the upstream Cluster Autoscaler. While functional, the Cluster Autoscaler was constrained by its reliance on cloud provider Auto Scaling Groups (ASGs). It functioned by observing pending pods and incrementing the desired capacity of a predefined, homogeneous ASG. This model is plagued by three fundamental inefficiencies:
- Slow Scaling Latency: Provisioning a new node via ASG, waiting for EC2 initialization, booting the OS, and registering with kubelet routinely requires 3 to 7 minutes.
- Stranded Hardware Capacity: Because ASGs are homogeneous, provisioning an oversized node to satisfy a single pending pod results in massive unutilized CPU and memory fragments.
- Inability to Consolidate Underutilized Nodes: The Cluster Autoscaler can only terminate a node if its utilization falls below a global threshold (e.g., 50%) AND all pods on that node can fit onto existing running nodes. It cannot replace two 30%-utilized nodes with a single smaller, cheaper instance type.
Karpenter (an open-source project incubated by AWS and adopted across multi-cloud environments) completely re-engineers cluster autoscaling. Karpenter bypasses Auto Scaling Groups entirely, communicating directly with the AWS EC2 Fleet API. When pods enter a pending state, Karpenter calculates the aggregate resource footprint, evaluates all available EC2 instance types across 40+ families, and provisions the exact right-sized instance in under 45 seconds.
Furthermore, Karpenter continuously executes automated consolidation. When it detects that running pods can be packed onto fewer or cheaper instances, it automatically provisions the optimal replacement node, drains the old nodes gracefully, and terminates the waste:
Spot Instance Orchestration Without Production Disruption
AWS and GCP Spot instances offer spare compute capacity at 60% to 80% discounts compared to standard On-Demand pricing. Historically, platform engineers avoided Spot instances in production out of fear of unexpected instance preemptions (AWS provides a 2-minute interruption notice via Amazon EventBridge and EC2 instance metadata; GCP provides a 30-second warning).
In 2026, orchestrating Spot instances in production with 99.99% availability is a solved architectural problem. The production blueprint requires three synchronizing components:
- Massive Instance Pool Diversification: Spot preemption occurs when overall cloud provider demand surges for a specific instance family in a specific AZ. By configuring Karpenter to select across 25+ instance types (mixing
c7g.xlarge,m7g.xlarge,r7g.xlarge,c6g.2xlarge, etc.), the probability of simultaneous preemption across all pools drops to near zero. - Automated Node Termination Handlers: Running Karpenter with native EventBridge SQS interruption queues or the open-source
aws-node-termination-handler. The moment AWS emits a 2-minute Spot Interruption Warning, the controller immediately cordons the node, executes graceful pod evictions, and triggers Karpenter to provision replacement nodes before the terminating node is reclaimed. - PodDisruptionBudgets (PDBs) and Graceful Shutdown: Every stateless microservice must declare a PDB specifying
minAvailable: 80%ormaxUnavailable: 1, paired with containerlifecycle.preStophooks andterminationGracePeriodSeconds: 60to allow in-flight HTTP transactions and DB connections to complete cleanly.
Graviton (ARM64) & Ampere Silicon Migration Economics
Continuing to run general-purpose containerized workloads on legacy x86_64 architecture (Intel Xeon or AMD EPYC) is an expensive architectural tax. AWS Graviton3 and Graviton4 processors (built on ARM Neoverse cores) deliver an unadjusted 20% reduction in hourly instance cost alongside a 15% to 25% improvement in compute performance per vCPU compared to equivalent 6th/7th-generation Intel instances.
| EC2 Instance Type | Architecture | vCPU / RAM | On-Demand Rate (us-east-1) | 3-Yr Compute SP Rate | Price / Performance Advantage |
|---|---|---|---|---|---|
c6i.2xlarge |
Intel x86_64 | 8 vCPU / 16 GiB | $0.3400 / hr | $0.1530 / hr | Baseline Reference |
c6a.2xlarge |
AMD x86_64 | 8 vCPU / 16 GiB | $0.3060 / hr | $0.1377 / hr | 10.0% savings vs Intel |
c7g.2xlarge |
AWS Graviton3 (ARM) | 8 vCPU / 16 GiB | $0.2720 / hr | $0.1224 / hr | 20.0% cost reduction + 19% IPC gain |
c8g.2xlarge |
AWS Graviton4 (ARM) | 8 vCPU / 16 GiB | $0.2856 / hr | $0.1285 / hr | 30.0% net throughput improvement |
Migrating containerized workloads to ARM64 is virtually frictionless in modern CI/CD pipelines. Using Docker's native docker buildx builder, engineering teams build and publish multi-architecture container manifests containing both linux/amd64 and linux/arm64 binaries from a single Git commit:
4. The Cross-AZ & Egress Network Tax: Eliminating the Silent Cost Multiplier
Network egress and cross-availability-zone data transfer represent the most treacherous line items in enterprise cloud billing. Unlike compute instances or persistent volumeswhich feature predictable, fixed monthly line itemsnetworking costs scale linearly with packet volume and data throughput. In high-traffic microservice meshes, distributed data streaming platforms (Apache Kafka), and distributed NoSQL databases, network transfer charges routinely exceed 20% to 30% of total cloud expenditure.
Deep Packet Routing Analysis: The $0.02/GB Inter-AZ Reality
Cloud providers engineer Availability Zones as physically isolated data center campuses interconnected by high-bandwidth, low-latency private optical metro rings. To monetize this dedicated physical transport, AWS and GCP bill inter-AZ data transfers symmetrically:
- Outbound Inter-AZ Egress: $0.01 per GB transmitted out of the source Availability Zone.
- Inbound Inter-AZ Ingress: $0.01 per GB received into the destination Availability Zone.
- Cumulative Round-Trip Surcharge: $0.02 per GB ($20.48 per TB).
Consider an enterprise e-commerce platform processing 10,000 HTTP requests per second. Each user request invokes an API gateway, an authentication service, an order routing engine, a product catalog cache, and a PostgreSQL database. If every intra-cluster hop transfers 50 KB of payload and cross-AZ traffic is unmanaged, the platform transfers:
\text{Unmanaged Cross-AZ Ratio: } 66.7\% \implies 6 \text{ TB/hour} \text{ crossing AZ boundaries}
6 \text{ TB/hr} \times 730 \text{ hrs/mo} \times \$20.48\text{/TB} = \mathbf{\$89,702.40 \text{ / month in pure cross-AZ network tax!}}
Kubernetes Topology-Aware Routing: Reclaiming 80% of Network Waste
To stop this catastrophic financial hemorrhage, Kubernetes introduced Topology-Aware Routing (formerly Topology-Aware Hints). When enabled on a Kubernetes Service, the endpoint controller evaluates the distribution of pods across availability zones. If pod capacity is proportionally balanced across zones, the controller annotates endpoints with zone hints, instructing kube-proxy and modern CNI plugins (such as Cilium eBPF) to route traffic strictly to pods residing in the identical availability zone as the caller.
If an availability zone suffers an infrastructure outage or pod crash storm, the topology routing algorithm automatically falls back to cross-zone endpoints, guaranteeing complete high availability without paying the continuous multi-thousand-dollar network tax during normal operation.
AWS Transit Gateway vs. Direct VPC Peering: The $0.02/GB Trap
AWS Transit Gateway (TGW) is widely deployed by enterprise enterprise architects because it simplifies multi-VPC hub-and-spoke routing. Rather than managing complex full-mesh VPC peering connections, network engineers attach all VPCs to a central TGW.
However, Transit Gateway introduces a punitive pricing structure:
- Attachment Fee: $0.05 per hour per VPC attachment (~$36.50/month per VPC).
- Data Processing Fee: $0.02 per GB for all data passing through the gateway.
In contrast, AWS Direct VPC Peering has:
- Attachment Fee: $0.00 (Free).
- Data Processing Fee: $0.00 (Free). Inter-VPC traffic is billed solely at standard inter-AZ rates ($0.01/GB each way).
Architectural Recommendation: Retain Transit Gateway strictly for low-bandwidth management VPCs, bastion hosts, and corporate VPN connectivity. For high-bandwidth East-West data highwayssuch as container clusters communicating with central Kafka streaming clusters, Snowflake/Databricks data lake ingestion pipelines, or core database tiersdeploy Direct VPC Peering. Bypassing TGW for high-throughput conduits immediately wipes out 100% of TGW data processing charges.
NAT Gateway Bypass Blueprint: Free S3 & DynamoDB Gateway Endpoints
AWS NAT Gateways are one of the most lucrative revenue generators for Amazon Web Services and one of the largest unmonitored line items on customer bills. An AWS managed NAT Gateway charges:
- Hourly Uptime: $0.045 per hour per NAT Gateway (~$32.85/month per AZ).
- Data Processing Fee: $0.045 per GB for all data processed.
When worker nodes in private subnets download Docker container images from Amazon ECR, stream backup snapshots to Amazon S3, or query Amazon DynamoDB tables, traffic routes through the VPC NAT Gateway by default. For a company streaming 50 TB of database backups and data lake parquet files to S3 monthly, routing through NAT Gateway costs:
51,200 \text{ GB} \times \$0.045 \text{/GB (NAT GW Data Processing)} = \mathbf{\$2,304.00 \text{ / month}}
AWS provides Gateway VPC Endpoints for Amazon S3 and Amazon DynamoDB completely FREE OF CHARGE ($0.00/hour and $0.00/GB data processing). Deploying a Gateway VPC Endpoint modifies the VPC route table, creating a direct, high-performance private route to AWS storage infrastructure that bypasses the NAT Gateway entirely:
Model Your Egress & Storage TCO Live: AWS S3 vs Cloudflare R2 vs Backblaze B2
Are outbound data transfer fees inflating your cloud bill? Use our production TCO calculator to simulate real workloads across varying storage volumes, read ratios, and API request classes. Compare AWS S3, Cloudflare R2, Google Cloud Storage, and Backblaze B2 with real 2026 pricing and zero hidden markups.
5. Storage Lifecycle FinOps: S3, EBS, and Cold Archive Optimization
Cloud storage expenditure exhibits an asymmetric economic profile: while storage pricing per gigabyte appears trivial on rate cards (measured in fractions of a cent), aggregate capacity expands monotonically over time. Unlike compute instances, which can be terminated when traffic subsides, unmanaged data lakes, persistent volume claims, and database snapshots persist forever. Achieving storage FinOps maturity requires automated tiering across the Amazon S3 economic spectrum and online conversion of block storage volumes.
Amazon S3 Storage Class Economics & Pricing Continuum
Amazon S3 provides seven distinct storage tiers, spanning a 23x price differential between hot transactional storage and deep cold archives:
| S3 Storage Tier | Storage Cost (us-east-1) | Retrieval Cost / GB | Min Billable Object Duration | Target Architectural Workload |
|---|---|---|---|---|
| S3 Standard | $0.0230 / GB-mo | $0.00 (Free) | None | Active application assets, dynamic web content, data < 30 days old. |
| S3 Intelligent-Tiering | $0.0230 down to $0.0040 | $0.00 (Free) | 30 Days | Unpredictable access patterns, mixed analytics lakes (> 128 KB files). |
| S3 Standard-IA | $0.0125 / GB-mo | $0.0100 / GB | 30 Days | Infrequently accessed backups, disaster recovery replicas, monthly reports. |
| S3 One Zone-IA | $0.0100 / GB-mo | $0.0100 / GB | 30 Days | Re-creatable secondary backups, transcode scratch spaces. |
| S3 Glacier Instant Retrieval | $0.0040 / GB-mo | $0.0300 / GB | 90 Days | Medical imaging, legal archives requiring millisecond access. |
| S3 Glacier Flexible Archive | $0.0036 / GB-mo | $0.0100 / GB | 90 Days | Quarterly compliance audits, legacy log archives (retrieval: 15 min5 hrs). |
| S3 Glacier Deep Archive | $0.00099 / GB-mo | $0.0200 / GB | 180 Days | 7-year regulatory retention, tax records, tape replacement (retrieval: 12 hrs). |
S3 Intelligent-Tiering Deep Dive: When It Saves vs. When It Costs MORE
Amazon S3 Intelligent-Tiering is marketed as a zero-operational-overhead solution: it automatically moves objects between Frequent, Infrequent, and Archive Access tiers based on observed access patterns without performance degradation or retrieval fees. However, platform architects must watch out for two critical economic conditions:
- The Monthly Automation Fee ($0.0025 per 1,000 objects): If your bucket contains 100 million micro-objects (e.g., 20 KB image thumbnails or IoT telemetry packets), you incur a fixed $250.00 monthly monitoring fee regardless of access.
- The 128 KB Minimum Billable Size: Objects smaller than 128 KB are never transitioned to infrequent access tiers. They remain permanently in the Frequent Access tier ($0.023/GB) while still being assessed the $0.0025/1,000 object monitoring charge.
\text{Let } S_{\text{avg}} = \text{average object size in MB}, \quad P_{\text{cold}} = \% \text{ of data becoming cold (>30 days)}.
\Delta \text{Cost per 1,000 objects} = \left( 1,000 \times \frac{S_{\text{avg}}}{1,024} \times P_{\text{cold}} \times (\$0.023 - \$0.0125) \right) - \$0.0025
\text{For 50 KB objects } (0.0488 \text{ MB}) \text{ with } 80\% \text{ cold data:}
\Delta \text{Cost} = \left( 1,000 \times \frac{0.0488}{1,024} \times 0.80 \times \$0.0105 \right) - \$0.0025 = \$0.0004 - \$0.0025 = \mathbf{-\$0.0021 \text{ (NET LOSS)}}
Architectural Rule: For micro-objects (< 128 KB), do NOT enable S3 Intelligent-Tiering. Instead, aggregate small files into compacted Parquet or Tar archives, or utilize deterministic S3 Lifecycle rules transitioning directly to Glacier Flexible Archive after 90 days.
S3 Express One Zone: High-Performance AI/ML vs. Storage Trade-offs
Introduced for ultra-low latency compute, S3 Express One Zone stores objects in single-AZ directory buckets, delivering single-digit millisecond data access. However, storage costs are steep: $0.16 per GB-month (nearly 7x more expensive than S3 Standard).
Where Express One Zone delivers dramatic FinOps savings is in API request pricing: PUT, COPY, POST, and LIST requests are 50% cheaper than S3 Standard ($0.0025 vs $0.005 per 1,000 requests). For AI/ML model training, GPU checkpointing, and real-time query engines where instances execute hundreds of millions of read/write operations daily, the massive savings on API call volume heavily outweighs the storage premium.
Automated EBS gp2 to gp3 Migration via Python Boto3
Legacy AWS General Purpose SSD (gp2) volumes couple baseline IOPS performance directly to provisioned storage capacity (3 IOPS per GB). To achieve 3,000 IOPS, engineers were forced to provision a 1,000 GB volume even if the application required only 50 GB of disk space.
Modern gp3 volumes deliver a baseline performance of 3,000 IOPS and 125 MB/s throughput completely free at any volume size, while reducing baseline storage rates from $0.10/GB to $0.08/GB (an unadjusted 20% discount). AWS Elastic Block Store allows live, online modification of active EBS volumes with zero downtime and zero volume unmounting.
The following production-ready Python Boto3 script audits all active gp2 volumes across an AWS region, calculates projected annual savings, and initiates online conversion to gp3:
Automated Orphan Volume Discovery & Snapshot Pruning
Unattached EBS volumes sit in available status, disconnected from any EC2 instance, yet continuing to accumulate full monthly capacity charges. Engineering teams should execute weekly automated sweeps using AWS Systems Manager or AWS CLI to identify and eliminate orphan volumes:
6. Observability & Telemetry FinOps: Decoupling Hot Search from Cold Analytics
In modern cloud-native architectures, observability platforms have quietly evolved into the third-largest infrastructure cost center, trailing only compute and primary relational databases. The rapid proliferation of microservices, distributed tracing spans, and high-frequency container deployments has triggered the "Observability Tax"a condition where monitoring, logging, and metrics bills grow exponentially faster than underlying revenue.
The Anatomy of the Commercial APM Ingestion Surcharge
Commercial SaaS observability platforms (Datadog vs Dynatrace, New Relic) utilize multi-vector billing models designed to capture maximum revenue at scale:
- Host & Container Licensing: Base charges ranging from $15 to $23 per host-month, plus surcharges for containers exceeding predefined ratios (e.g., $0.002 per container-hour for containers beyond 20 per host).
- Log Ingestion Tax: Charging $0.10 per GB for ingestion, plus an additional $1.70 to $2.50 per million events for 15-day or 30-day index retention.
- Custom Metric Cardinality Penalty: $5.00 per month for every 100 custom metrics. If an engineer inadvertently adds an
order_idoruser_idtag to a Prometheus counter, metric cardinality explodes to 500,000 distinct time-series, generating an unexpected $25,000 monthly custom metric invoice. - Distributed APM Traces: Charging $1.70 per million analyzed spans, plus $1.70 per million ingested spans retained for querying.
Edge Filtering & Dynamic Sampling with Vector
The architectural solution to runaway observability billing is edge decoupling. Applications must never stream raw telemetry directly into commercial SaaS endpoints. Instead, telemetry must pass through an intermediary edge pipelinepowered by high-performance engines like Timber.io Vector (written in Rust) or the OpenTelemetry Collector.
An edge telemetry pipeline implements three essential FinOps controls:
- Discarding Low-Value Health Checks: Eliminating HTTP 200 responses from Kubernetes liveness and readiness probes (
/healthz,/metrics,/ready). In high-density clusters, health checks constitute 40% to 60% of gross log volume. - PII Scrubbing and Metadata Sanitization: Stripping verbose JSON fields, stack traces from non-error payloads, and credit card / bearer token headers at the host boundary.
- Dynamic Probabilistic Sampling: Sampling successful 2xx HTTP transaction logs at 5% while preserving 100% of 4xx and 5xx errors:
Decoupling Hot Search from Cold Analytics via ClickHouse
Retaining petabytes of unstructured text in Elasticsearch, OpenSearch, or Datadog for 90 to 365 days is financially ruinous. In modern FinOps architectures, organizations decouple hot search (active incident response over the trailing 7 days) from cold analytical querying.
By streaming raw logs into Amazon S3 compressed with Zstandard (ZSTD) and cataloging them in high-performance columnar analytical databases like ClickHouse vs StarRocks or serverless engines like AWS Athena, organizations achieve lightning-fast SQL forensic search across billions of historical log lines at a fraction of the cost:
\text{Monthly Cost for 20 TB in ZSTD Parquet on S3 Standard-IA + ClickHouse:} \quad 2,000 \text{ GB (10:1 ZSTD compression)} \times \$0.0125 = \mathbf{\$25 / mo}
\mathbf{\text{Net Structural Telemetry Cost Reduction: } 99.5\%}
7. Commitment-Based Discount Engineering: Savings Plans, RIs & CUDs Without Lock-in
Once compute, network, storage, and telemetry architectures have been right-sized and stripped of structural waste, organizations unlock the most powerful financial lever in cloud procurement: commitment-based discount instruments. Cloud providers trade massive hourly rate discounts (up to 72%) in exchange for predictable, multi-year revenue commitments.
However, naive commitment purchasing represents an existential financial risk. If an organization over-commits to rigid instance-locked instruments before executing containerization, Graviton migration, or architectural consolidation, it finds itself paying for "stranded commitments"contractual financial obligations for phantom infrastructure that engineers have already decommissioned.
The 2026 Enterprise Commitment Spectrum
Modern cloud architects must master the trade-offs across four primary commitment categories:
| Commitment Instrument | Provider | Max Discount | Flexibility Across Families | Flexibility Across Regions | Secondary Resale Market |
|---|---|---|---|---|---|
| AWS Compute Savings Plans | AWS | Up to 66% | Full (EC2, Fargate, Lambda) | Full (Any AWS Region) | No |
| AWS EC2 Instance Savings Plans | AWS | Up to 72% | Locked to specific family (e.g., c7g) | Locked to specific region | No |
| AWS Standard Reserved Instances (RIs) | AWS | Up to 72% | Locked to specific instance type | Locked to specific region | Yes (AWS RI Marketplace) |
| GCP Flexible Committed Use Discounts | GCP | Up to 46% | Full across Compute Engine | Full across regions | No |
| GCP Resource-Based CUDs | GCP | Up to 57% | Locked to machine family (e.g., N2, C3) | Locked to specific region | No |
The Watermarking Commitment Strategy: The 70/80 Rule
To capture maximum rate discounts while preserving absolute technical agility, FinOps teams implement the Watermarking Strategy. Rather than committing to 100% of current compute spend, the organization establishes a mathematical floor based on historical trailing usage:
\text{1. Baseline Non-Terminating Floor (70% to 75%):} \quad \text{Covered by 3-Year No-Upfront Compute Savings Plans.}
\text{2. Predictable Medium-Term Growth (10% to 15%):} \quad \text{Covered by 1-Year Partial-Upfront Savings Plans.}
\text{3. Volatile Peak & Batch Capacity (10% to 20%):} \quad \text{Satisfied by Spot Instances (60%-80% discount) & On-Demand.}
Stacking Architecture: 3-Tier Commitment Watermark
Why Compute Savings Plans Outperform EC2 Instance Savings Plans
While EC2 Instance Savings Plans offer slightly higher top-line discounts (up to 72% vs 66%), they legally lock the organization to a specific instance family within a single geographic region (e.g., m6i in us-east-1).
In a rapidly evolving hardware environment, this restriction is lethal. If an engineering team commits $50,000/month to an m6i Instance Savings Plan for 3 years, they are contractually barred from adopting AWS Graviton3 (c7g/m7g) or Graviton4 (c8g). The 6% incremental discount of the locked plan is completely wiped out by forfeiting the 20% to 35% architectural price-performance leap of modern ARM silicon. Always prioritize Compute Savings Plans for enterprise agility.
8. Comprehensive FinOps Tooling Landscape: 2026 Architectural Audit
The cloud financial management software ecosystem has bifurcated into distinct categories: developer-first Kubernetes cost allocation engines, autonomous AI-driven infrastructure scalers, multi-cloud enterprise visibility portals, and shift-left policy-as-code analyzers. Selecting the appropriate tooling stack depends on organizational maturity, regulatory boundaries, and container density.
In-Cluster FinOps Kubecost & OpenCost
Deploys natively inside Kubernetes clusters via Helm. Ingests local cgroup metrics from Prometheus and maps real-time cloud provider billing APIs to specific namespaces, StatefulSets, daemonsets, and labels. Emits detailed cost metrics for network egress, persistent storage, and CPU/memory allocations. OpenCost is the underlying CNCF sandbox specification.
Autonomous Scaling CAST AI
A closed-loop autonomous Kubernetes platform. Goes beyond passive reporting by actively executing real-time pod right-sizing, Karpenter-like instance bin-packing, automated spot-to-on-demand failovers, and live cluster defragmentation. Delivers automated 50%+ cost reductions with zero human engineering intervention.
Multi-Cloud Visibility Vantage
A modern enterprise multi-cloud cost observability platform. Ingests billing pipelines across AWS, GCP, Azure, Snowflake, Datadog, and Kubernetes. Features virtual tagging, financial unit metric modeling, automated commitment trading, and executive board-level dashboards without requiring agent installations inside production VPCs.
Shift-Left FinOps Infracost
Integrates directly into CI/CD pipelines (GitHub Actions, GitLab CI, Bitbucket) and analyzes Terraform, OpenTofu, and CloudFormation pull requests. Parses planned infrastructure changes and leaves automated pull request comments detailing exact monthly dollar impacts before code is merged to production.
25-Row Comprehensive Architectural Matrix
The following evaluation matrix audits the premier commercial and open-source FinOps technologies operating in 2026:
| FinOps Solution | Category | Core Architectural Strength | Primary Technical Limitation | Deployment Model | K8s Granularity | Pricing Structure | Ideal Enterprise Profile |
|---|---|---|---|---|---|---|---|
| Kubecost Enterprise | K8s Cost Allocation | Deep pod/namespace cost attribution; network egress tracking; on-prem & cloud support. | Requires Prometheus management; high memory footprint in large clusters (>100k pods). | In-cluster Agent (Helm) | Pod / Container / Label | Per-node monthly subscription | Kubernetes-heavy mid-market and enterprises with complex multi-tenant shared clusters. |
| OpenCost (CNCF) | Open-Source K8s FinOps | 100% vendor-neutral; lightweight; zero SaaS telemetry exfiltration; CNCF standard. | Lacks advanced executive dashboards, forecasting, and automated commitment management. | Self-hosted in-cluster | Pod / Container / Namespace | Free / Open-Source (Apache 2.0) | Security-conscious engineering teams desiring sovereign in-house FinOps metric pipelines. |
| CAST AI | Autonomous Optimization | Automated real-time node bin-packing; automated spot interruption protection; live defrag. | Requires broad cluster admin permissions (mutating webhooks); proprietary SaaS control plane. | Hybrid (Agent + SaaS Engine) | Full Workload & Node Level | Guaranteed % of verified savings | Fast-growing scale-ups seeking turnkey automated cost reduction without hiring FinOps staff. |
| Vantage | Multi-Cloud FinOps SaaS | Virtual tagging across disparate clouds; Snowflake/Datadog cost integration; modern UI. | Less granular real-time Kubernetes kernel-level network tracing than eBPF CNI tools. | SaaS (Read-Only Cloud APIs) | Namespace / Label / Cluster | Tiered by analyzed cloud spend | Modern tech enterprises operating across multi-cloud (AWS + GCP) and SaaS data warehouses. |
| Infracost | Shift-Left IaC Governance | Blocks expensive PRs before merge; parses Terraform/Terragrunt; developer-friendly. | Cannot detect runtime usage waste, zombie idle instances, or unattached disk orphans. | CI/CD Pipeline Plugin | IaC Resource Level | Freemium / Team per-seat model | Engineering organizations with mature GitOps workflows enforcing infrastructure-as-code. |
| AWS Cloud Intelligence Dashboards (CID) | Native Cloud BI | Zero third-party SaaS fees; runs on Athena + QuickSight; deep CUR 2.0 data fidelity. | Complex initial CloudFormation deployment; requires maintaining custom SQL queries. | Native AWS Account Pipeline | Account / Service / Tag | AWS Athena / QuickSight usage only | Large AWS-centric enterprises seeking 100% data sovereignty without external SaaS vendors. |
9. Contextual Benchmark Synergy & Architectural Cross-Pollination
FinOps is not an isolated discipline restricted to billing dashboards; it is the financial expression of underlying technical architecture. Every infrastructure decisionwhether choosing an eBPF-based container network interface, selecting a distributed cache engine, deciding between GitOps controllers, or adopting a serverless databaseimposes immediate, measurable consequences on corporate unit economics.
To design an optimized enterprise architecture, platform teams must evaluate how specific technology selections interact across the entire stack:
eBPF Network Optimization: Cilium vs Calico
As analyzed in our deep benchmark Cilium vs Calico, replacing legacy iptables and kube-proxy with pure Linux kernel eBPF reduces inter-pod network latency by up to 40% while unlocking native Layer 7 socket-layer load balancing. Cilium's ability to enforce zone-local pod redirection without traversing Linux netfilter chains eliminates hundreds of thousands of dollars in annual cross-AZ data processing surcharges.
Multi-Tenant Consolidation: vCluster vs Namespaces
In our architectural analysis vCluster vs Kubernetes Namespaces, we explore how running virtual Kubernetes clusters inside a shared host cluster slashes control-plane management fees ($73/month per AWS EKS cluster) and dramatically improves hardware bin-packing efficiency compared to provisioning dozens of isolated, underutilized physical clusters.
Log & Analytical Sinks: ClickHouse vs StarRocks
As documented in ClickHouse vs StarRocks, modern high-throughput columnar analytical databases provide 10:1 to 14:1 data compression ratios on structured telemetry logs. Decoupling cold log storage from expensive Elasticsearch clusters and routing into ClickHouse or Amazon S3 archives reduces long-term observability retention costs by over 90%.
APM & Observability Tax: Datadog vs Dynatrace
Our deep dive into Datadog vs Dynatrace highlights the commercial pricing mechanisms that trigger runaway observability invoices. Deploying edge transformation pipelines and OpenTelemetry filtering protects organizations from punitive per-gigabyte ingestion fees and high-cardinality metric penalties.
Cloud Control Planes: Crossplane vs Terraform
In Crossplane vs Terraform, we evaluate declarative continuous reconciliation versus static drift detection. Crossplane enables platform teams to expose self-service, right-sized infrastructure claims to developers directly through the Kubernetes API, embedding FinOps policy guardrails and lifecycle destruction timeouts natively into resource manifests.
Serverless In-Memory Caching: Upstash vs Redis Cloud
Our benchmark Upstash vs Redis Cloud evaluates per-request serverless pricing models against provisioned memory instances. For erratic or bursty serverless workloads (AWS Lambda, edge functions), adopting per-request caching eliminates 100% of idle instance provisioning costs.
Autonomous Kubernetes Sizing: Kubecost vs CAST AI
In Kubecost vs CAST AI, we contrast visibility-first cost attribution with automated, closed-loop machine-learning optimization. While Kubecost delivers superior multi-tenant showback and chargeback reporting, CAST AI provides autonomous real-time node bin-packing and instant spot rebalancing.
Enterprise Data Warehouse FinOps: Snowflake vs Databricks
In Snowflake vs Databricks, we dissect enterprise warehouse credit consumption models, auto-suspend timeouts, serverless compute tiers, and data lakehouse architectures, providing mathematical formulas to optimize multi-million-dollar big data processing pipelines.
10. 3-Year Enterprise TCO Mathematical Models: Scenarios for $25k, $100k, and $500k/Month
To justify the engineering capital required to execute structural FinOps interventions, platform architects must provide executive leadership with rigorous mathematical models. The following multi-year Total Cost of Ownership (TCO) models evaluate three distinct organizational profiles:
\text{Net Annual Savings: } S_{\text{net}} = \sum_{m=1}^{12} \left( C_{\text{unoptimized}}^{(m)} - C_{\text{optimized}}^{(m)} \right) - C_{\text{tooling}} - C_{\text{eng}}
\text{Net Present Value (NPV): } \text{NPV} = \sum_{t=1}^{3} \frac{S_{\text{net}}^{(t)}}{(1 + r)^t} - I_0, \quad \text{where } r = 0.08 \text{ (discount rate)}, \, I_0 = \text{initial migration CapEx}.
\text{Payback Period: } P = \frac{I_0 + C_{\text{tooling}} + C_{\text{eng}}}{\text{Monthly Gross Savings}}
Scenario A: Growth SaaS
- Overprovisioned EKS worker nodes on x86_64.
- S3 Standard buckets with zero lifecycle rules.
- Unattached EBS gp2 volumes from destroyed testing rigs.
- Unmonitored NAT Gateway routing all S3 traffic.
Scenario B: Mid-Market SaaS
- High-cardinality Datadog logging and custom metrics.
- Substantial cross-AZ network traffic ($14k/mo).
- Zero Spot instance adoption; static cluster autoscaling.
- Fragmented On-Demand EC2 spend without Savings Plans.
Scenario C: Enterprise Unicorn
- Multi-region AWS & GCP multi-cloud deployment.
- Heavy AWS Transit Gateway data processing fees ($35k/mo).
- Massive data lakes on S3 Standard exceeding 4 Petabytes.
- Overprovisioned container memory limits triggering OOM cascades.
3-Year Financial Projection Table: Scenario B ($100k/Month Mid-Market)
The table below demonstrates the detailed financial trajectory of Scenario B over a 36-month horizon, incorporating initial engineering refactoring CapEx, ongoing FinOps tooling subscriptions, and compounding rate optimization:
| Financial Dimension | Year 0 (Status Quo) | Year 1 (Implementation) | Year 2 (Optimization) | Year 3 (Autonomous) |
|---|---|---|---|---|
| Gross Infrastructure Spend | $1,200,000 | $740,000 | $672,000 | $672,000 |
| FinOps Tooling Subscriptions | $0 | $24,000 | $24,000 | $24,000 |
| Engineering Refactoring Investment | $0 | $45,000 (Initial Sprints) | $15,000 (Maintenance) | $15,000 (Maintenance) |
| Net Operational Expenditure (OpEx) | $1,200,000 | $809,000 | $711,000 | $711,000 |
| Net Annual Cash Savings | $0 | $391,000 | $489,000 | $489,000 |
| Cumulative 3-Year Net Savings | $0 | $391,000 | $880,000 | $1,369,000 (NPV: $1,215,400) |
11. Step-by-Step 90-Day Cloud Cost Reduction Implementation Playbook
Executing a successful enterprise FinOps turnaround requires a structured, phased implementation roadmap. Attempting to execute complex commitments before right-sizing infrastructure leads to stranded financial capacity, while modifying container autoscaling without proper disruption budgets triggers production outages.
Platform engineering teams must execute this proven 90-day four-phase playbook:
Phase 1: Days 115 Discovery, Hygiene & Ghost Assets
- Activate AWS CUR 2.0 / GCP BigQuery Export: Ingest raw, unaggregated billing logs with resource-level tags into Amazon Athena or BigQuery.
- Purge Orphan Ghost Storage: Run automated scripts to terminate unattached EBS volumes in
availablestatus and delete unattached Elastic IPs. - Clean Orphan Snapshots: Enforce retention expiration windows on legacy EBS and RDS snapshots older than 90 days.
- Scheduled Dev/Staging Scale-Down: Deploy cron-based controllers (such as
kube-downscaler) to scale non-production environments to zero outside business hours (saving 70% of dev compute).
Phase 2: Days 1645 Kubernetes Compute Modernization
- Deploy Karpenter & NodePools: Replace static Auto Scaling Groups with Karpenter. Enable
WhenEmptyOrUnderutilizedconsolidation. - Audit Pod Requests with VPA: Run Vertical Pod Autoscaler in recommendation mode to right-size CPU/Memory requests to p95 historical usage.
- Orchestrate Spot for Stateless Replicas: Configure PodDisruptionBudgets, deploy AWS Node Termination Handlers, and diversify Spot across 25+ instance pools.
- Adopt AWS Graviton3/4 (ARM64): Migrate stateless microservices to ARM64 container images via multi-arch Docker builds for an instant 20% price-performance gain.
Phase 3: Days 4670 Network Tax & Storage Modernization
- Deploy S3 & DynamoDB Gateway Endpoints: Modify VPC route tables to route all S3/DynamoDB traffic privately, completely bypassing the $0.045/GB NAT Gateway data fee.
- Enable Kubernetes Topology-Aware Routing: Annotate Service manifests with
service.kubernetes.io/topology-mode: Autoto eliminate 75%+ of cross-AZ traffic. - Batch Convert EBS gp2 to gp3: Execute automated Python Boto3 scripts to convert 100% of gp2 volumes online to gp3, capturing an instant 20% discount.
- Implement S3 Lifecycle Rules: Configure bucket transitions to Glacier Flexible Archive after 90 days and Glacier Deep Archive after 180 days.
Phase 4: Days 7190 Telemetry Decoupling & Commitments
- Deploy Vector / OTel Edge Pipeline: Filter out high-frequency HTTP health checks and debug logs before ingestion into commercial APM tools.
- Scrub High-Cardinality Metrics: Sanitize Prometheus and Datadog metric labels to strip ephemeral user IDs and transaction UUIDs.
- Execute Watermarked Compute Savings Plans: Commit 70% to 75% of static baseline compute to 3-year Compute Savings Plans.
- Shift-Left with Infracost in CI/CD: Enforce automated pull request cost estimation in GitHub Actions, preventing expensive IaC regressions.
12. Enterprise Governance, Allocation & Culture (FinOps Maturity Model)
Sustainable cloud cost optimization is fundamentally a cultural discipline supported by automated policy enforcement. Without institutional governance, optimized cloud environments inexorably regress into bloated waste within two to three quarters as new features are shipped and engineering teams rotate.
Transitioning from Showback to Chargeback
In the early stages of cloud maturity, organizations utilize Showbackproviding engineering managers with passive monthly reports indicating how much money their team spent. While informative, showback lacks accountability; engineering leadership faces zero budget repercussions for wasteful provisioning.
Mature FinOps organizations enforce true Chargeback. Cloud infrastructure expenditures are deducted directly from each product line's operational budget. Shared platform overheadsuch as central Kubernetes control planes, network transit backbones, CI/CD runners, and enterprise supportis apportioned proportionally based on active CPU core consumption or message queue throughput:
Enforcing Tagging Hygiene with Policy-as-Code
Accurate cost allocation requires pristine resource tagging. Trying to enforce tagging hygiene manually through wiki guidelines or post-provisioning audits always fails. Platform teams must enforce tagging programmatically at resource creation time using Policy-as-Code frameworks such as Open Policy Agent (OPA) Gatekeeper or Kyverno.
The following Kyverno ClusterPolicy automatically denies the admission of any Kubernetes Deployment, StatefulSet, or Job that lacks mandatory FinOps tags:
Cultivating a High-Performance FinOps Engineering Culture
The ultimate goal of enterprise FinOps is not to restrict engineering innovation, but to provide developers with continuous, transparent feedback loops. Top-tier engineering organizations cultivate cost-aware cultures through:
- Shift-Left Pull Request Visibility: Integrating Infracost into GitHub Actions so every engineer sees the exact monthly dollar impact of their infrastructure changes directly within pull request discussions.
- Gamified Efficiency Leaderboards: Recognizing and rewarding engineering squads that achieve the lowest unit cost per transaction or the highest pod bin-packing density.
- Blameless FinOps Architecture Reviews: Conducting quarterly retrospective analyses on cloud billing anomalies without punitive blame, treating cost spikes with the identical technical rigor applied to high-severity production outages.
13. Frequently Asked Questions (FAQ)
Below are technical answers to the most critical architectural questions encountered when designing and executing enterprise FinOps transformations across AWS, GCP, and Kubernetes:
service.kubernetes.io/topology-mode: Auto) alongside zone-aware ingress controllers or eBPF-based CNI routing (such as Cilium local-node and local-zone redirection), service traffic is programmatically pinned to pods within the originating availability zone. This architectural pattern immediately reduces cross-AZ network volume by 70% to 85% without sacrificing high-availability failover semantics.
WhenEmptyOrUnderutilized), terminating under-allocated nodes and live-migrating pods to denser, cheaper hardware.
cpu.cfs_quota_us and cpu.cfs_period_us (typically 100ms periods). When a multi-threaded application (such as Go, Java, or Node.js) bursts compute across multiple OS threads, it can consume its allocated quota within the first 15ms to 20ms of the period. The kernel violently throttles all container threads for the remaining 80ms, generating catastrophic p99 latency spikes and HTTP timeouts even when the underlying host node has 60% idle CPU capacity. Platform engineers frequently misinterpret this throttling as under-provisioning and over-allocate node compute to compensate. Modern FinOps best practice dictates removing CPU limits entirely for general workloads (relying on right-sized CPU requests for scheduling) or utilizing Burstable QoS alongside CPU CFS quota burst mechanisms.
Interactive Cloud FinOps TCO & ROI Calculator
Model your organization's custom cloud expenditure and calculate the immediate financial impact of implementing Karpenter autonomous bin-packing, Graviton ARM64 migration, cross-AZ traffic elimination, and commitment watermarking: